Categories
Reporting

5 Tips to Building Your Digital Marketing Reports

‘Plan – Launch – Optimize’. While you follow this principle to gain the best out of your marketing campaigns, here are 5 tips to get you going with building digital reports.

TIP 1: Define your KPIs

To define your KPI, start by revisiting your objective that has been agreed upon by the key stakeholders. Next, map the objectives against various metrics. Have a look at the table below that lists out a set of sample KPIs based on different objectives.

Objective Possible KPIs
Awareness/ Visibility
  • Impressions
  • Reach
  • Views
  • Clicks
Lead Generation
  • Number of form-fills
  • Number of asset downloads
  • Cost per lead
Sales
  • Number of sales
  • Average revenue
  • Cost per sale
  • ROAS (Return on Ad Spend)
Engagement
  • Number of interactions (Likes, comments, shares, etc.)
  • Time spent on the website
  • Pages per session

Tip 2: Reason to build the report

Are you building your report to showcase the results to your Stakeholders, or is the report going to help you optimize the account? The format of the reports will change based on your answer to this question. Stakeholders want to see an overall performance, a summary of how the campaign is doing. While a report meant for inputs to optimize campaigns will dig deeper and identify each and every metric that has seen a change in the positive or negative direction.

Here are examples of the format you could follow for each of the requirement:

Stakeholder report: An overview of what is happening in the account, what is working and what is not, where you stand against your goals & what’s the next steps planned

Analyst report: A detailed breakdown of performance based on metrics (KPIs) for each elements such as campaigns, ads, landing pages, etc which can be used as a base to optimize your campaigns

Tip 3: Select a Format that is Repeatable

While zeroing down on a report format, remember that this has to be done on a regular basis. So ensure that you capture the right KPIs and that the format should be easy to continuously replicate. 

Tip 4: Analyzing the data

This is the most important step in building reports. While analyzing the data, start with the top down approach. Identify the performance at an account level, do you see an increase or a dip in performance? If you find an improvement in performance, start digging in deeper till you reach the lowest level of tactics like keywords, placements, text ads, banner ads, etc, and identify the different causes of the impact by analyzing the metrics that are your KPIs. Once done, don’t forget to repeat the same exercise for tactics to identify the ones that saw a dip in performance. This will help you catch instances that will continue to negatively impact your campaign.

Tip 5: Automate Your Report

Since you are going to build the same reports over and over (in terms of format), start optimizing and automating your reports to save time and reduce human error. There are various ways of getting this done – 

  1. You can use APIs to fetch data faster in a format that is easier to analyse, and build Macros to initiate your analysis
  2. You can also manually fetch the data and use Macros to build the required format and initiate your analysis
  3. The 3rd option is to identify a 3rd party tool that generates your stakeholder/analysis ready reports

Implementing these 5 tips will help you define your report, analyze your data, and finally save on time. This can have a direct impact on the campaigns you run as you can start optimizing based on the insights and the time saved can be used to define your next steps.

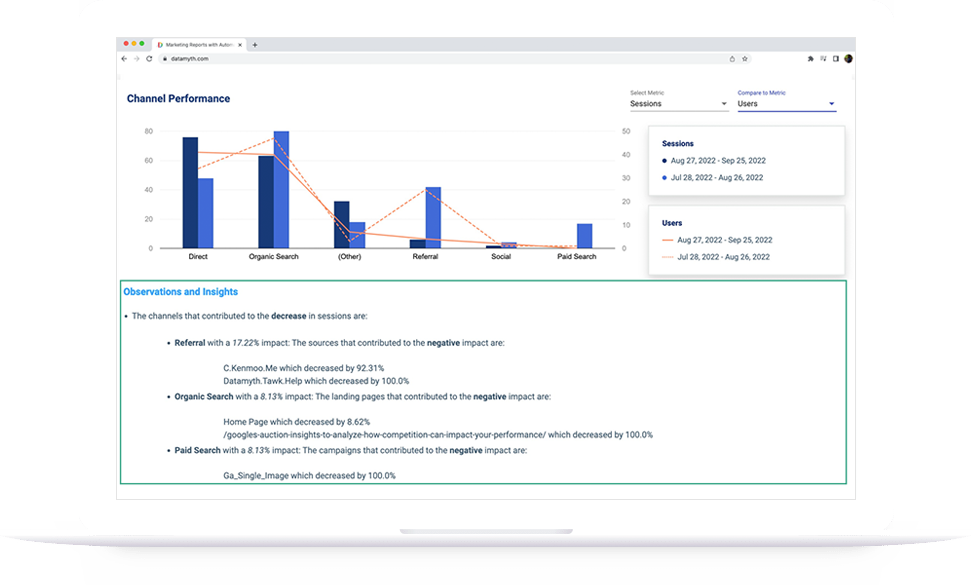
DataMyth is a report automation tool that provides insights and reduces the time taken to build reports from an average of 7 hours a week to a few minutes. Interested in checking out DataMyth? Fill out the form.

Categories
Reporting

Digital Marketing Report Frequency & Their Outcomes

Report building is very critical for any agency or brand. With the right KPIs measured in the reports, a campaign manager/stakeholder can understand how his marketing campaigns are performing & can   make data backed decisions. Most agencies or companies share reports with their clients/stakeholders on a regular basis. It can be weekly, monthly and/or quarterly. This blog covers the different report frequencies and what are the outcomes you can expect. 

Daily Reports:

Daily reports are used mainly for internal purposes which include the KPIs, critical and important to your client/stakeholders. It helps you identify any anomalies or changes and you can act immediately. 

Example: If the Campaign ‘actual daily spend’ is more than the target spend, you can spot it immediately and modify it accordingly. 

Daily Report Outcome:

  • With Daily reports in place, you can find a trend in your campaign/website performance 
  • You can spot anomalies in KPIs which need immediate attention 
  • A constant status check on the performance against goals 
  • Ensure that both the campaign manager & the client/stakeholders are on the same page

Weekly Reports:

With weekly reports you can measure performances against your short term plans and  track variances compared to the previous period performance. Along with it you will be able to identify metrics/elements that  are working and the ones that  are not, based on the tasks carried out with respect to their results. You can share the weekly reports during the first two days of the week (Monday & Tuesday) and plan for the week. The day can be finalised based on your convenience and your clients. Some reports are scheduled based on the stakeholder’s meeting with higher-ups, which would need the most recent data. In general these meetings happen in the first 3 days of the week (Monday – Wednesday), So you would end up creating the weekly report on the previous day of the meeting.

Example: Introducing a new set of keywords during a week could either boost your conversions or result in a high cost. You need a couple of days to gather significant data and see if the newly added keywords impact your performance in positive or negative. However, this could be an initial check to see if the keywords are spending without any outcome.

Weekly Report Outcome:

  • You can check  if the performance increased or decreased, with reasons that identify the  campaign, keyword, channel or landing page responsible for the impact
  • You will be able to clearly identify what is working and what is not, based on the tasks carried out, and compared to short term goals
  • You can plan your actions according to the recent performance

Monthly Reports:

Monthly reports are the best way you can highlight your campaign KPIs which are critical to your client/stakeholder. You can showcase results of the long term plans/actions taken over a period of time, determine where you stand against the goals, and define if the campaign is on track or not. The monthly reports help the Directors/CMOs to plan their marketing efforts going forward.

Monthly Report Outcome:

  • Like weekly reports, even these reports help you understand what is working and what is not, for a longer time frame as weekly data is generally not sufficient to take decisions
  • Which channel or campaign impacted your performance 
  • Your plans/recommendations to derive better results and either recalibrate goals or recalibrate plans to meet the goal

Here’s a quick summary of the 3 reports:

You can use daily reports internally while the weekly & monthly reports are made for clients/stakeholders as well as  to optimize the campaign. Ensure the Weekly & Monthly reports cover the main elements  in the summary slides such as

  1. Ensure that all the important KPIs are covered
  2. What happened & why it happened
  3. Was the performance in line with your previous plan or not? 
  4. What is your plan/recommendation to either improve performance or maintain it?
Categories
Reporting

Defining the Structure of a Digital Marketing Report

While you share your digital marketing reports with your client/stakeholder, it is necessary to  pre-empt all possible questions your client/stakeholder may have. Your digital marketing report should contain the status of your campaign performance, where you are against your target, how efficient your plans were, keywords and ads responsible for the performance impact. So if you were to lay out all this information in a report, this blog provides a structure that you could follow. And if this is a recurring report, use the first 2-3 reports to define the structure with your stakeholder

Here’s a quick structure that can get you going:

  1. A Summary section
  2. Performance by channel, campaign, network, etc
  3. Visualize your data
  4. Optimization impact  
  5. Next Steps

Summary Section:

Your summary should be clear and concise which can be understood not only by the marketing team but anybody. Highlight the important aspects of your performance & along with the result, the reason for it, and what does that mean for the brand. Your summary should also talk about where the account stands when compared to your goals (short term & long term). Think of this section as one that gives all the information required to know if the campaigns are performing or not, with reasons. Ensure that you don’t go overboard by providing all the information possible. Take a call on what’s important and what’s not. As mentioned earlier, use the first 2-3 reports to define the content with your stakeholders.

Performance by channel, campaign, network, etc.:

Every metric critical to your client/stakeholder should be analysed and compared with the goals set. This will help you understand if your marketing campaigns are working or not. To add value to your reports, ensure that you don’t just add tables and charts, but add critical data driven analysis insights based on the KPIs. Your campaign performance should answer a) what has changed since last reporting, b) the corresponding reason, c) how the change impacts your performance.

Visualize Your Data:

Turn your data into visuals which are easy to read and understand. Ensure to use elegant colors so your reader does not get distracted  with the choice of your colors (danger red, fluorescent green). Always try to find a balance between creativity and clarity. A clear, simple  and aesthetically created digital marketing report template enhances the style. 

Optimization Impact :

It is very important to understand how your performance behaved or changed based on the optimization  carried out during the reporting period. This will help you and your client/stakeholder understand what is working and what is not to define the next steps. 

Next Steps:

Finally, you need to clearly list out your next steps based on your findings from the above steps. This  becomes your plan to optimize the campaigns, so be specific about how you are going to achieve your goals. Being specific will also create a clear path for your client/stakeholder’s marketing efforts moving forward. 

Implementing these 5 tips will help you build comprehensive digital marketing reports. You can make your reporting easy & fun instead of a worrisome weekly task. 

DataMyth is a report automation tool that provides ready-to-use reports with automated analysis that reduces the time taken to build reports from an average of 7hours a week to a few minutes. Interested in checking out DataMyth? Take the Free Trial.