While you share your digital marketing reports with your client/stakeholder, it is necessary to pre-empt all possible questions your client/stakeholder may have. Your digital marketing report should contain the status of your campaign performance, where you are against your target, how efficient your plans were, keywords and ads responsible for the performance impact. So if you were to lay out all this information in a report, this blog provides a structure that you could follow. And if this is a recurring report, use the first 2-3 reports to define the structure with your stakeholder
Here’s a quick structure that can get you going:
- A Summary section
- Performance by channel, campaign, network, etc
- Visualize your data
- Optimization impact
- Next Steps
Summary Section:
Your summary should be clear and concise which can be understood not only by the marketing team but anybody. Highlight the important aspects of your performance & along with the result, the reason for it, and what does that mean for the brand. Your summary should also talk about where the account stands when compared to your goals (short term & long term). Think of this section as one that gives all the information required to know if the campaigns are performing or not, with reasons. Ensure that you don’t go overboard by providing all the information possible. Take a call on what’s important and what’s not. As mentioned earlier, use the first 2-3 reports to define the content with your stakeholders.
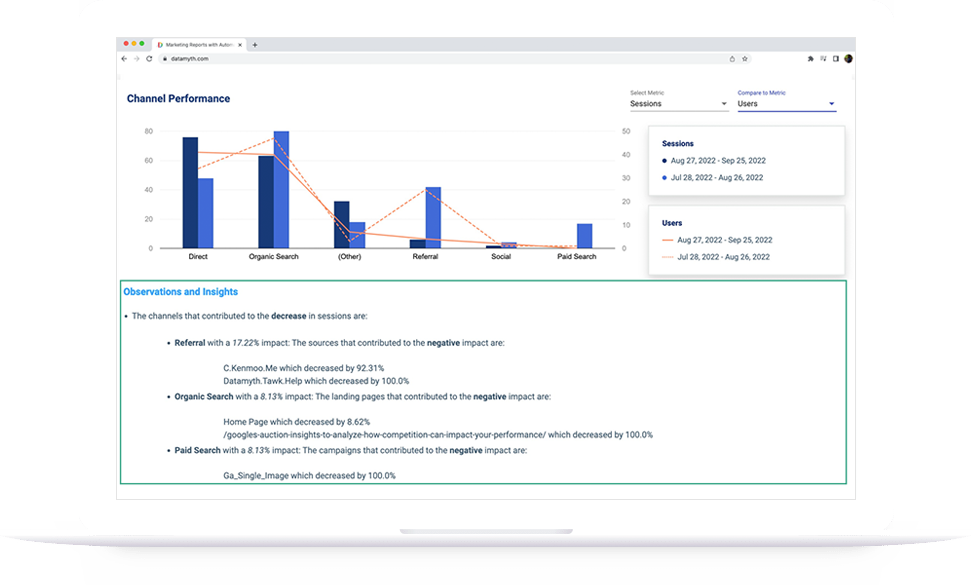
Performance by channel, campaign, network, etc.:
Every metric critical to your client/stakeholder should be analysed and compared with the goals set. This will help you understand if your marketing campaigns are working or not. To add value to your reports, ensure that you don’t just add tables and charts, but add critical data driven analysis insights based on the KPIs. Your campaign performance should answer a) what has changed since last reporting, b) the corresponding reason, c) how the change impacts your performance.
Visualize Your Data:
Turn your data into visuals which are easy to read and understand. Ensure to use elegant colors so your reader does not get distracted with the choice of your colors (danger red, fluorescent green). Always try to find a balance between creativity and clarity. A clear, simple and aesthetically created digital marketing report template enhances the style.
Optimization Impact :
It is very important to understand how your performance behaved or changed based on the optimization carried out during the reporting period. This will help you and your client/stakeholder understand what is working and what is not to define the next steps.
Next Steps:
Finally, you need to clearly list out your next steps based on your findings from the above steps. This becomes your plan to optimize the campaigns, so be specific about how you are going to achieve your goals. Being specific will also create a clear path for your client/stakeholder’s marketing efforts moving forward.
Implementing these 5 tips will help you build comprehensive digital marketing reports. You can make your reporting easy & fun instead of a worrisome weekly task.
DataMyth is a report automation tool that provides ready-to-use reports with automated analysis that reduces the time taken to build reports from an average of 7hours a week to a few minutes. Interested in checking out DataMyth? Take the Free Trial.