As a digital marketer one has to create daily, weekly and monthly reports. Even though it may feel monotonous it is a critical part of your business. As per a survey conducted by DataMyth, we found that companies spend an average of 7.5 hours a week building various digital marketing reports with analysis which is almost an entire day every week. So you have a resource who spends time building reports wherein he/she could spend this time optimizing campaigns or taking up additional responsibilities. While you may figure out ways to automate your reports, you still need to analyze the data and present it to your client/stakeholders. What if you figure out a way to automate this entire process (report generation to analysis)? This blog will introduce you to automating reports, its advantages, and ways you can do so.
Reporting Automation in Simple Terms
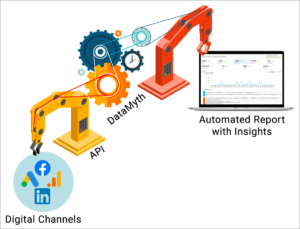
Connect all your digital channels to a software/platform that builds your daily, weekly and monthly marketing reports within seconds/minutes. All digital channels provide APIs that fetch your data and the automated reporting software/platform builds your report.
Why should you automate your reports?
- Hours of reporting reduced to seconds
- We’ve discussed how the time taken to build your reports can be reduced to seconds. You can end the blind data ‘copy-paste’, downloading various csv files and analyzing the data to identify insights. With automated reporting, ready to use reports will be available at the click of a button within seconds.
- Focus on new initiatives
- Now that the reporting is automated with performance insights, you know exactly what is working and what is not. You can spend your precious time on optimizing & taking on additional initiatives for your business.
- Increase your team’s effectiveness
- For agencies, you can increase the number of clients handled per analyst, and brands, you can focus on additional initiatives with small & agile teams
Which tool is best for me?
There are a lot of tools available in the market right from BI (Business Intelligence) dashboards to reporting solutions.
- While BI tools provide full funnel reports, they are complicated to set up and need to be maintained by SMEs/experts.
- Dashboard tools (like Google Data Studio) are not as complicated as BI tools, but not easy to use. You can connect your channels & create dashboards but you might need to pay in order to connect the channels
- Many reporting tools available in the market let you drag and drop KPIs & graphs creating a simple dashboard ready to be shared with your client. This is easy to use, needs a one time setup & the user friendliness depends on the tool.
All the above mentioned tools provide the data you need in various templates (some are fixed & some offer custom templates), but once you receive the data in the desired format, you spend significant time analyzing the data which most of the tools do not provide.
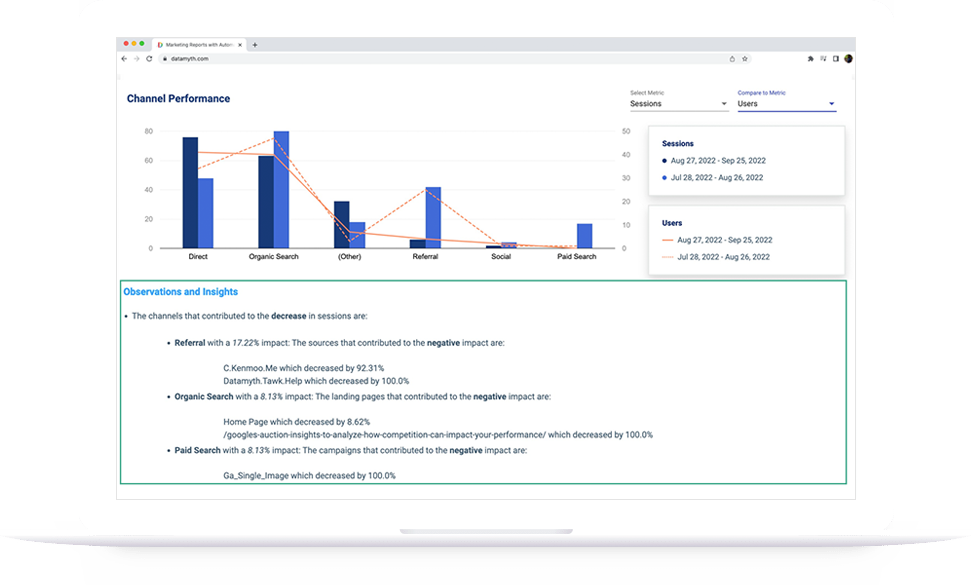
Here’s where DataMyth can help. Created by marketer who wanted to skip downloading, processing and analyzing data. It’s an easy to use tool with pre-built templates for each channel (Google Ads & Google Analytics to start with) with automated analysis and performance insights for the KPIs which matter the most to marketers. Reports built with DataMyth can be downloaded as a PDF & shared with stakeholders/clients.
While this may sound too good to be true, have a look at how we simplify your process below, and take the 7 day free trial to see for yourself.


