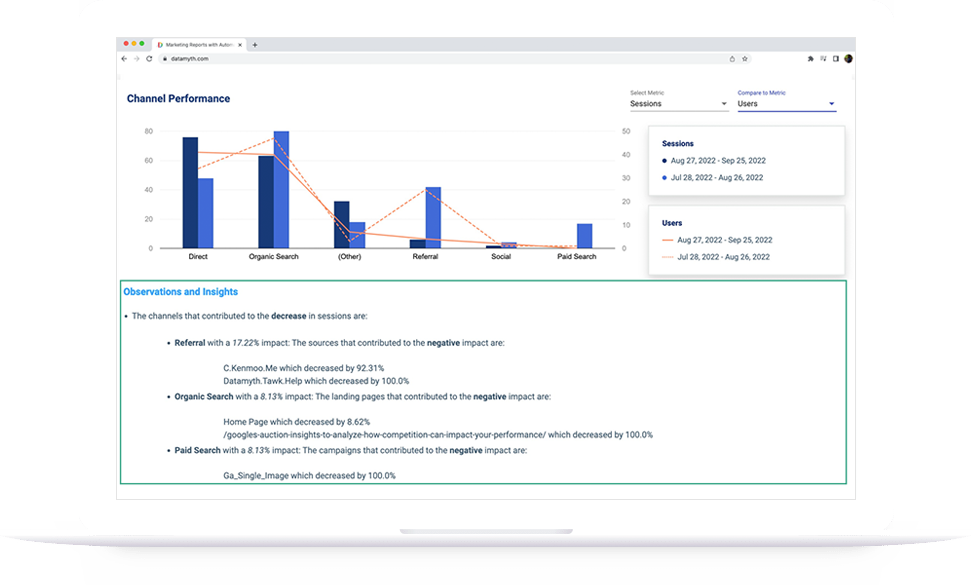
‘Plan – Launch – Optimize’. While you follow this principle to gain the best out of your marketing campaigns, here are 5 tips to get you going with building digital reports.
TIP 1: Define your KPIs
To define your KPI, start by revisiting your objective that has been agreed upon by the key stakeholders. Next, map the objectives against various metrics. Have a look at the table below that lists out a set of sample KPIs based on different objectives.
| Objective | Possible KPIs |
| Awareness/ Visibility |
|
| Lead Generation |
|
| Sales |
|
| Engagement |
|
Tip 2: Reason to build the report
Are you building your report to showcase the results to your Stakeholders, or is the report going to help you optimize the account? The format of the reports will change based on your answer to this question. Stakeholders want to see an overall performance, a summary of how the campaign is doing. While a report meant for inputs to optimize campaigns will dig deeper and identify each and every metric that has seen a change in the positive or negative direction.
Here are examples of the format you could follow for each of the requirement:
Stakeholder report: An overview of what is happening in the account, what is working and what is not, where you stand against your goals & what’s the next steps planned
Analyst report: A detailed breakdown of performance based on metrics (KPIs) for each elements such as campaigns, ads, landing pages, etc which can be used as a base to optimize your campaigns
Tip 3: Select a Format that is Repeatable
While zeroing down on a report format, remember that this has to be done on a regular basis. So ensure that you capture the right KPIs and that the format should be easy to continuously replicate.
Tip 4: Analyzing the data
This is the most important step in building reports. While analyzing the data, start with the top down approach. Identify the performance at an account level, do you see an increase or a dip in performance? If you find an improvement in performance, start digging in deeper till you reach the lowest level of tactics like keywords, placements, text ads, banner ads, etc, and identify the different causes of the impact by analyzing the metrics that are your KPIs. Once done, don’t forget to repeat the same exercise for tactics to identify the ones that saw a dip in performance. This will help you catch instances that will continue to negatively impact your campaign.
Tip 5: Automate Your Report
Since you are going to build the same reports over and over (in terms of format), start optimizing and automating your reports to save time and reduce human error. There are various ways of getting this done –
- You can use APIs to fetch data faster in a format that is easier to analyse, and build Macros to initiate your analysis
- You can also manually fetch the data and use Macros to build the required format and initiate your analysis
- The 3rd option is to identify a 3rd party tool that generates your stakeholder/analysis ready reports
Implementing these 5 tips will help you define your report, analyze your data, and finally save on time. This can have a direct impact on the campaigns you run as you can start optimizing based on the insights and the time saved can be used to define your next steps.
DataMyth is a report automation tool that provides insights and reduces the time taken to build reports from an average of 7 hours a week to a few minutes. Interested in checking out DataMyth? Fill out the form.


