
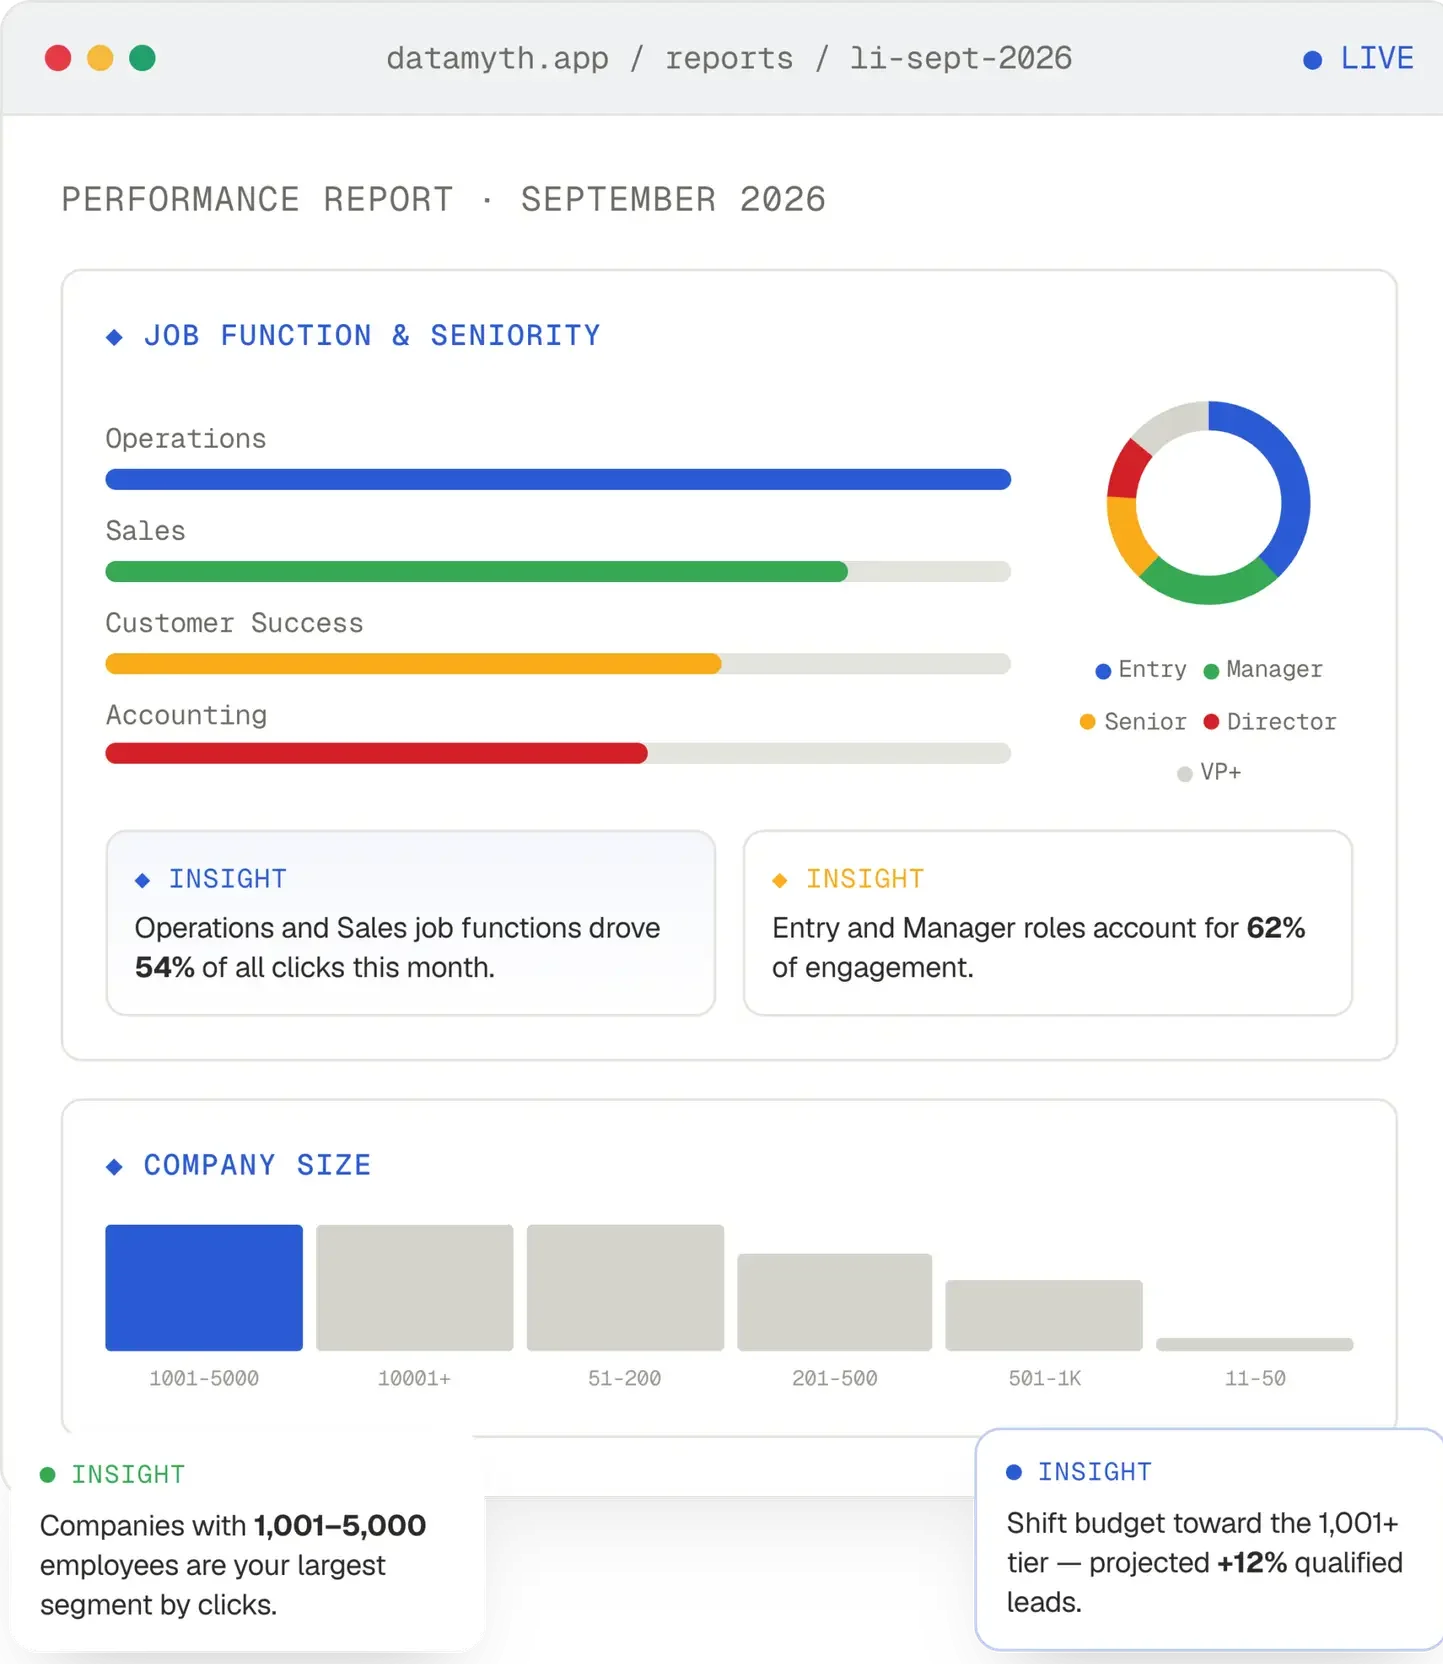
Impact-ranked insights by company, job function, and seniority, built directly from your live LinkedIn Campaign Manager data.
To generate impact-ranked insights from live data
Saved per week, per demand-gen manager
Setup time from OAuth to first report
Reduction in manual reporting time
Monitor campaigns on a live LinkedIn Ads dashboard, then send the same data as a dated, written report to your client or CMO. Both come from one connection to Campaign Manager, so the numbers always match.
Monitor spend, results and cost per result whenever you need them.
A fixed snapshot of the period with context, analysis and next steps.
Source: Campaign Manager · same numbers in both
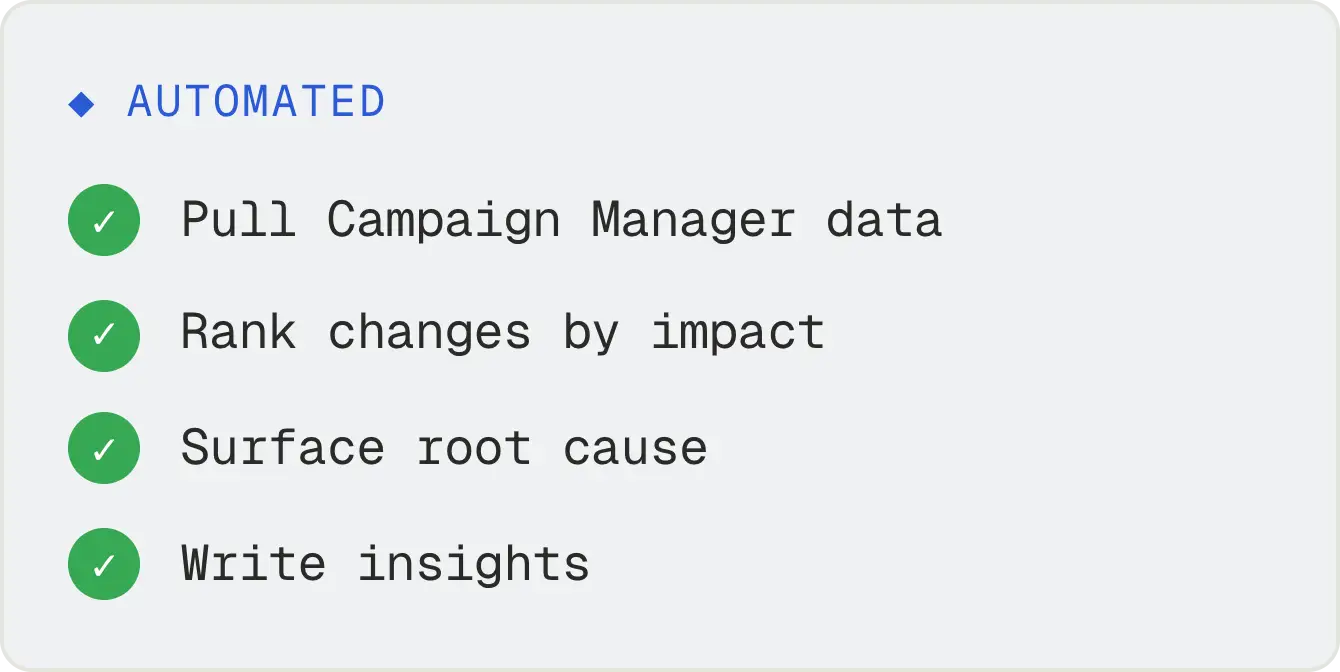
DataMyth analyzes and presents the reasons for a change in performance based on impact, in a few clicks, surfacing nuances in your campaigns that would otherwise go undetected.
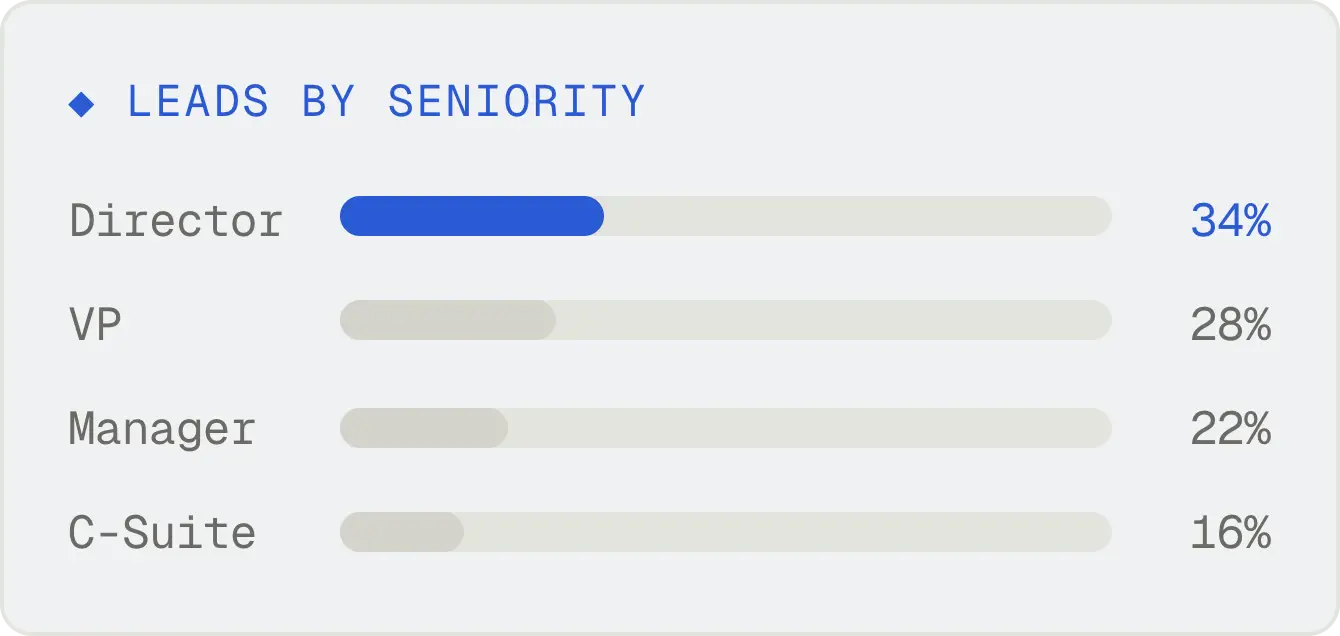
See performance broken down by company, industry, job function, and seniority, so you know which titles and accounts are actually driving pipeline.
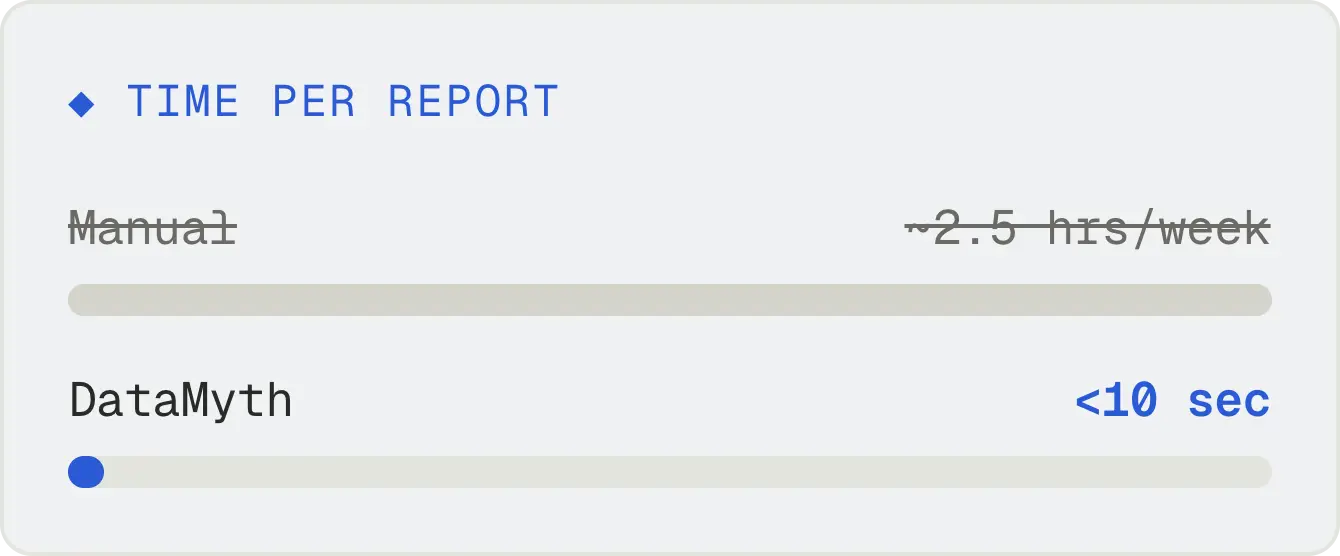
Leave the analysis to DataMyth and focus on optimizing targeting and bids. Reports ship automatically, cutting reporting time by 95%.
Ready to see your own LinkedIn Ads account broken down this way? Start a free trial, no card required.
Each report leads with the numbers that fit the goal, so a good campaign never looks bad for the wrong reason.
Campaign Manager shows what happened. DataMyth explains why, ranking the reasons performance changed by impact.
Choose weekly or monthly delivery as a PDF, shareable link or email.
Reporting for several clients? See how DataMyth works for marketing agencies →
Sign in and grant access. Setup takes about 5 minutes.
Pick the LinkedIn Ads report template and a date range.
Check the insights, add your logo, then send the report or schedule it.
Build and get access to reports with analysis in seconds, every time you run one.
Build as many reports as you need, whether reporting to stakeholders or optimizing campaigns yourself.
Read-only, LinkedIn-native access keeps your campaign data secure and fully compliant.
"Creating reports for clients always took a good amount of time — until I found DataMyth. It adds Google Analytics, Search Console and Facebook accounts and creates an analyzed report within minutes."

"The report they provide is so good. Connect Google Analytics or Search Console and you get a report on your business in a minute — it explains why my traffic looks the way it does."

"DataMyth reports are easy to use and easy to understand. No complex settings like other solutions — connecting to data is easy and efficient."

"I use DataMyth to see how my audience is interacting with my content and what the engagement rate is. The graphs showing performance by group and section are really helpful."

"Setup took about 5 minutes and DataMyth proved its name — I found a hidden gem in a placement that was working best. The founder is responsive and keeps adding features."

"Most reporting solutions are complicated, not very good, or crazy expensive. DataMyth fits right in the sweet spot — clean data, lots of insight, no mortgage payment required."

"DataMyth offers a very user-friendly, simple, and powerful reporting tool. Within minutes you can build a report with graphs, data, and analysis — no technical setup required."

"DataMyth supports Facebook Ads, Google Ads, Search Console and Google Analytics — all easily connected. It produces detailed performance reports based on the metrics I choose."

"DataMyth helps me save at least 6 man hours a week while running and scaling client Fb and Google ads. Super easy to keep a check on the metrics I care about."

A LinkedIn Ads report summarises how your campaigns performed over a set period using Campaign Manager data: spend, results and cost per result, plus performance by company, job function and seniority. A good report also explains what changed and why, which DataMyth writes automatically.
A dashboard is a live view you check while campaigns run. A report is a fixed snapshot of a period, written for someone else, such as a client or CMO, with context and next steps. DataMyth gives you both from the same data.
Match them to the objective: reach, frequency and CPM for awareness; clicks, CTR and CPC for website visits; leads, cost per lead and lead form completion rate for lead generation. For B2B, add the demographic breakdown by company, job function and seniority.
LinkedIn counts a conversion when a member clicked or viewed an ad within the attribution window, and records it against the ad’s timeline. Your CRM records a lead when it is created or qualified, often days later. Agree one definition with your client and state which source each number comes from.
LinkedIn’s Marketing API documentation notes that professional demographic metrics are approximate, can lag behind campaign metrics by 12 to 24 hours, and drop values with fewer than three events to protect member privacy. Small segments can therefore be missing or not add up to campaign totals.
Monthly suits most B2B accounts because sales cycles are long and weekly data is often too thin to act on. Add a short weekly check-in while you are testing new audiences or creative.
Yes. The Paid Media Performance Report puts LinkedIn Ads, Google Ads and Meta Ads side by side with a written cross-channel analysis.
Yes. Add your logo, or each client’s logo, then download a PDF, share a link or schedule delivery.
Connect your account and get a full report with impact-ranked insights in under 10 seconds, no manual digging required. Spend the time you get back on pipeline strategy, not spreadsheets.