Categories
Marketing

How to Present Marketing Data to Clients: A Practical Guide to Turning Numbers Into Decisions

How to present marketing data to clients is a skill that most agencies develop by trial and error over years of client calls where the client asked “but what does this mean?” or “what should we do about this?” after receiving a report. The pattern in those questions is always the same: the data was present, but the interpretation and the action were missing.

Knowing how to present marketing data clearly is what separates an agency that delivers reports from an agency that delivers decisions. This guide covers the specific practices, narrative structure, chart selection, language choices, and data hierarchy, that make marketing data immediately useful to the clients who receive it.

Why Is Presenting Marketing Data Difficult?

Most marketers are more comfortable with data than their clients are. The gap creates a communication challenge: the metrics that feel intuitive to an experienced practitioner (ROAS, engagement rate, impression share) feel opaque to a business owner or CFO evaluating whether their marketing investment is working.

Presenting marketing data effectively requires translating from the language of the platform to the language of the client’s business goal. A retail CFO does not care what impression share means, they care whether the campaign is producing profitable sales. A B2B founder does not care what average session duration means, they care whether the content is producing qualified leads.

The translation is the agency’s job. The client should not have to do it themselves.

What Narrative Structure Works for Marketing Data Presentations?

How to present marketing data effectively follows a consistent narrative structure, regardless of whether the presentation is a written report, a slide deck, or a call:

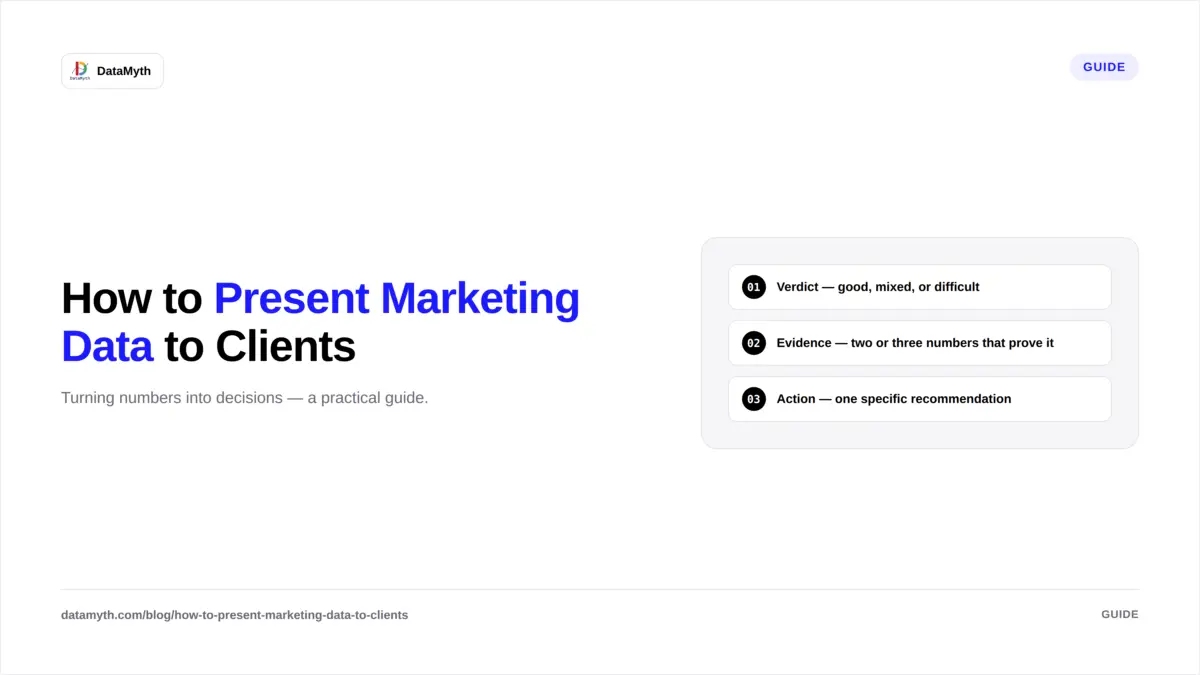
Structure 1: Verdict — Evidence — Action

  1. Verdict: What was the result of the period? Good, mixed, or difficult — and why in one sentence.
  2. Evidence: Which specific metrics support the verdict? Show the two or three numbers that prove the statement, with period comparison.
  3. Action: What should change as a result? One specific, testable recommendation.

This structure works because the client learns the conclusion before the data, which means they process the data as confirmation of something they already understand rather than as a puzzle they are assembling.

Structure 2: Problem – Cause – Solution

Use this structure for report sections where performance underperformed:

  1. Problem: Cost per lead increased 32% month-over-month.
  2. Cause: Average keyword position dropped from 2.1 to 3.6 due to increased competitor bidding on our top three keywords.
  3. Solution: We are raising bids on the three affected keywords by 15% and adding two alternative keywords that show strong volume at lower competition.

This structure demonstrates analytical depth (the cause, not just the symptom) and proactive management (the solution is already in progress, not pending).

How Do You Choose the Right Chart for Marketing Data?

Chart selection is the most commonly made error in how to present marketing data to clients. The wrong chart type makes data harder to understand even when the data itself is correct.

Data to showRight chartWrong chart
Performance over time (trend)Line chartBar chart, pie chart
Comparison across categoriesHorizontal bar chartPie chart, area chart
Single key metric vs targetKPI tile / gaugeLine chart with cluttered context
Channel breakdown by volumeHorizontal bar chartPie chart
Funnel stages (conversion rates)Funnel chart / waterfallPie chart, line chart
Geographic performanceMap or ranked tablePie chart

The pie chart problem: Pie charts require the viewer to estimate the angular difference between segments to compare them, a task humans do very poorly. A horizontal bar chart showing the same category breakdown allows immediate visual comparison of lengths. For almost all marketing data use cases, a bar chart or table is more readable than a pie chart.

The cluttered line chart problem: Line charts with more than five data series become unreadable. If you need to show seven channels’ performance trends simultaneously, use a table with conditional formatting (green for positive trend, red for negative) rather than a seven-line chart.

How Do You Translate Technical Marketing Metrics Into Business Language?

The core skill in how to present marketing data is translation. Specific translation examples:

Technical metricClient-facing translation
CTR: 4.2%“4.2% of people who saw the ad clicked it, above average for this sector”
Impressions: 450,000“Your ads appeared 450,000 times to potential customers this month”
Engaged sessions: 12,400“12,400 visitors spent meaningful time on the site, reading content, viewing products, or completing a goal”
ROAS: 4.2“For every $1 spent on Google Ads, $4.20 in revenue was attributed to those campaigns”
Impression share: 68%“Your ads appeared in 68% of relevant searches; 32% were missed, mainly due to budget limits”
Quality Score: 7/10“Google rates our ad and landing page quality at 7 out of 10, which means we are paying less per click than lower-scored competitors”

The translation pattern: explain what the metric measures in one sentence, provide the client’s number, give the directional verdict (above/below average, improving/declining), and connect it to a business outcome where possible.

How Does DataMyth Help Present Marketing Data?

How to present marketing data clearly is a core function of DataMyth’s reporting platform. DataMyth generates written analysis that translates each metric movement into a business narrative, explaining what changed, attributing a cause, and contextualising against prior period performance. The account manager reviews and refines this analysis rather than writing it from scratch.

The report output formats (PDF, shareable link) are structured to follow the verdict-evidence-action narrative structure, with headline KPI tiles at the appropriate visual weight and channel sections following the consistent hierarchy that makes data easy to navigate. See DataMyth’s reporting output.

What Should You Avoid When Presenting Marketing Data?

Avoid jargon without explanation. The first time any technical term appears in a client-facing report, include a one-sentence definition in parentheses. Thereafter it can stand alone.

Avoid presenting every available metric. Twelve metrics per channel section is too many. Prioritise the five or six that directly answer whether the campaign is working. Additional metrics move to the appendix.

Avoid positive spin that hides problems. A report that leads with high impressions when conversion rate dropped significantly is presenting the right data in the wrong order. Lead with the verdict, not the most flattering metric.

Avoid no recommendation. Data presented without a recommended action is a description, not strategic reporting. Every report section should end with “therefore we recommend…” or the equivalent.

How Do You Present Marketing Data in a Live Client Call?

How to present marketing data in a live call differs from a written report because the client can ask questions in real time, and the order of information matters more. Practical guidance:

Start with the verdict before sharing the screen. Before opening the report, state the verdict verbally: “May was a strong month, conversions were up 24% and cost per lead dropped significantly. I want to walk you through what drove this and what we are doing in June.” The client now processes the data as confirmation, not as a puzzle they are assembling.

Share the executive summary first. Walk through each line of the executive summary rather than jumping to the detailed channel sections. The summary provides the structure; the detailed sections answer follow-up questions.

Let the client see the data before explaining it. When transitioning to a chart or table, give the client 10-15 seconds to review the visual before narrating it. Clients who have processed the data themselves are more engaged with the explanation than clients who hear the narrative while still scanning the numbers.

End every section with the action. After narrating each channel’s performance, close with: “Based on this, in June we are going to [specific action].” This moves the conversation from review to decision-making, which is where the agency earns its strategic value.
Categories
Marketing

How to Choose a Marketing Analytics Platform in 2026

Every marketing team needs a marketing analytics platform, a place where data from every channel is gathered, organized, and made useful. The problem is that “marketing analytics platform” now describes three very different categories of software: data visualization tools, reporting automation tools, and AI-driven insight platforms. Choosing between them requires being clear about what problem you actually have.

This guide defines the categories, sets out seven evaluation criteria, and gives agencies and in-house teams a framework for picking a platform that fits what they need now, not what looks impressive in a demo.

What Is a Marketing Analytics Platform?

A marketing analytics platform is software that connects your marketing data sources, aggregates the data in one place, and presents it in a structured format for analysis and reporting. Beyond that definition, platforms diverge significantly:

  • Data visualization tools (Looker Studio, Tableau): powerful for building custom dashboards but require manual analysis. They show you what happened; they do not explain why.
  • Reporting automation platforms (DashThis, AgencyAnalytics): automate data pulling and report formatting. They remove the manual export step but still leave the written analysis to you.
  • AI-driven insight platforms (DataMyth): automate the data pull, the formatting, and the written performance analysis, identifying what changed, why, and ranking causes by degree of impact.

Most buyers start by comparing price and integrations. The more useful comparison is: where in the reporting workflow does this tool stop helping you?

What Are the Key Criteria for Choosing a Marketing Analytics Platform?

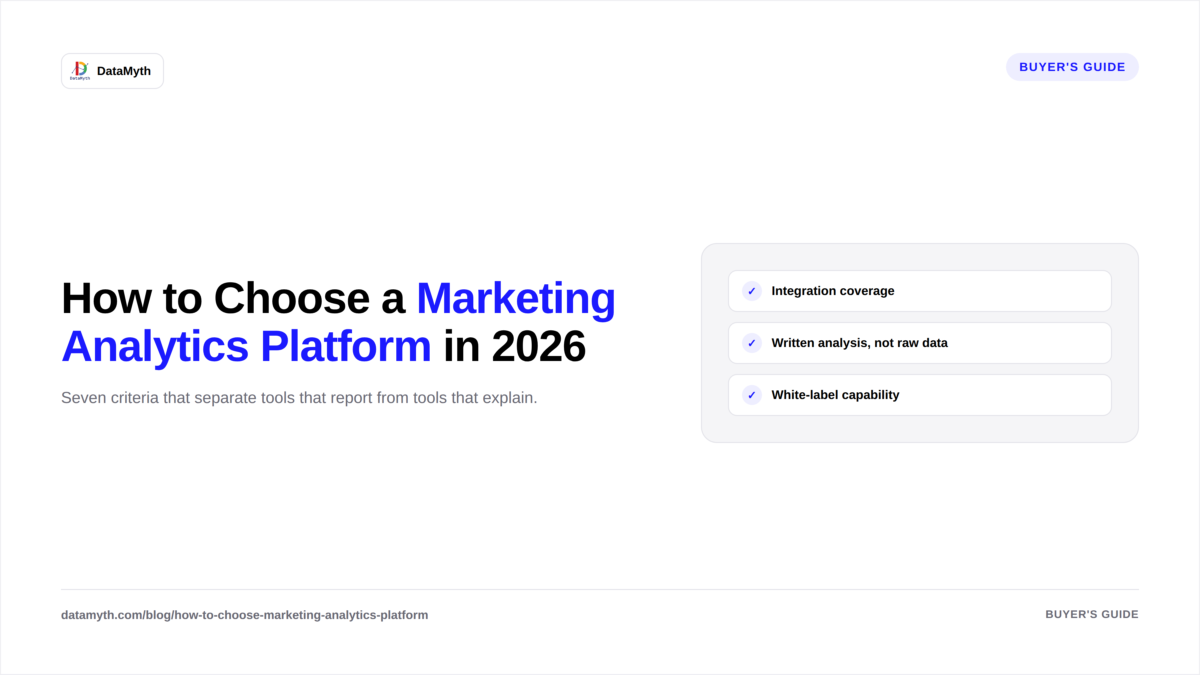
Evaluate a marketing analytics platform against these seven criteria before committing:

1. Integration coverage. Does it connect to the channels you actually use? Core integrations to require: GA4, Google Ads, Facebook Ads, LinkedIn Ads, Google Search Console. If you use HubSpot, Shopify, or email platforms, confirm those connections too. An analytics platform is only as useful as the data it can access.

2. Written analysis vs. raw data. Does the platform interpret the data or just display it? Tools that produce charts and tables require you to write the analysis. Tools that generate written performance narratives, explaining what changed and why, recover hours of agency time per client per month. This is the most consequential difference between categories and the one most often overlooked in demos.

3. White-label capability. For agencies, white-labeling is non-negotiable. Every client-facing report should carry the agency’s brand. Confirm whether white-labeling is included in the base plan or gated behind higher tiers.

4. Scheduling and automation. Can the platform generate and deliver reports automatically on a set cadence? Manually triggering reports every month defeats the purpose of a reporting tool. Scheduling should be configurable by client, with different cadences for different accounts.

5. Multi-account management. Agencies managing 20+ clients need a platform designed for account-level management, not a tool that requires a separate login per client. Confirm that the platform surfaces all accounts in one view and supports bulk operations.

6. Pricing model alignment. Per-client pricing scales badly for agencies. Per-seat pricing is opaque when teams grow. Look for pricing models that align with how you actually work, flat-rate with unlimited reports and accounts is the cleanest for agencies.

7. Time-to-first-report. How long does it take to go from sign-up to first client report? If onboarding takes two weeks and requires developer support, the platform will be underused. The fastest tools connect channels and generate a first report in under an hour.

How Is a Marketing Analytics Platform Different from a Dashboard Tool?

DimensionDashboard tool (e.g., Looker Studio)Marketing analytics platform (e.g., DataMyth)
Data connectionManual or semi-automatedAutomated, OAuth-based
Report formatVisual charts; you design the layoutPre-built templates by channel
Written analysisNone, you write itAutomated, generated with the report
White-labelLimited or requires workaroundsNative, per-client
SchedulingNone nativeScheduled delivery by cadence
PricingFree (Looker Studio) or per-seatPer account or flat-rate
Learning curveHigh (requires template-building skill)Low (connect and generate)
Best forAnalysts who want full controlAgencies and teams who want reporting done

The clearest signal for which category you need: if you spend more than two hours per client per month writing commentary on your own charts, you need a platform that writes it for you. If you have a dedicated analyst who enjoys building custom views, a visualization tool gives more flexibility.

What Should Agencies Look for That In-House Teams Don’t?

Agencies evaluating a marketing analytics platform have requirements that in-house teams don’t:

  • Multi-client architecture: One interface showing all client accounts, each with separate templates, schedules, and branding. Not a per-account login.
  • Scalable pricing: Adding the 25th client should not require a call with sales or a pricing negotiation. Confirm upfront.
  • White-label everything: Not just the report logo, the report URL, the PDF export filename, and any client-facing interface.
  • Consistent output across accounts: Every client report should look professionally consistent, not like a different team member did each one.
  • Written analysis that saves account-manager time: The written narrative is the highest-effort part of reporting. Automating it is what lets an agency scale from 15 to 30 clients without hiring another account manager.

How Much Does a Marketing Analytics Platform Cost?

Marketing analytics platform pricing ranges from free (Looker Studio, which requires full self-service) to $50–$400/month for mid-market tools depending on accounts, users, and features. For agencies:

  • Tools that charge per-client: pricing scales with your client count, which is the worst model for growing agencies
  • Tools with flat-rate unlimited accounts: predictable cost regardless of how many clients you add
  • Enterprise tools: custom pricing, often negotiated annually

DataMyth offers a 7-day free trial with no credit card required. See DataMyth pricing for current plan details.

What is a marketing analytics platform?

A marketing analytics platform is software that connects your marketing data sources, aggregates the data, and presents it for reporting and analysis. Advanced platforms also generate written analysis of what changed in performance and why, beyond just displaying charts.

What is the difference between a marketing analytics platform and a dashboard?

A dashboard displays data visually; you interpret and write the analysis yourself. A marketing analytics platform automates the data pull, report format, and ideally the written performance narrative, reducing the manual reporting workload significantly.

What integrations should a marketing analytics platform have?

At minimum: GA4, Google Ads, Facebook Ads, LinkedIn Ads, and Google Search Console. If your clients use email platforms, CRMs, or e-commerce tools, confirm those integrations as well.

Which marketing analytics platform is best for agencies?

The best marketing analytics platform for agencies has multi-client architecture, white-label reporting, scheduled delivery, and automated written analysis. Evaluate tools on those four criteria specifically, not just on the number of integrations or visual design of dashboards.

How long does it take to set up a marketing analytics platform?

The fastest tools connect channels via OAuth and generate a first report in under an hour. More complex tools with custom dashboard builders can take days or weeks. For agency use, prioritize time-to-first-report as an evaluation criterion.

Is a marketing analytics platform worth it for small agencies?

Yes, if you report to more than three or four clients regularly. The time saved on manual data export, formatting, and writing commentary typically pays for the platform within the first month. The secondary benefit, consistent, branded reports, also supports client retention.

Categories
Marketing

Digital Marketing KPIs: The Agency Client Reporting Framework

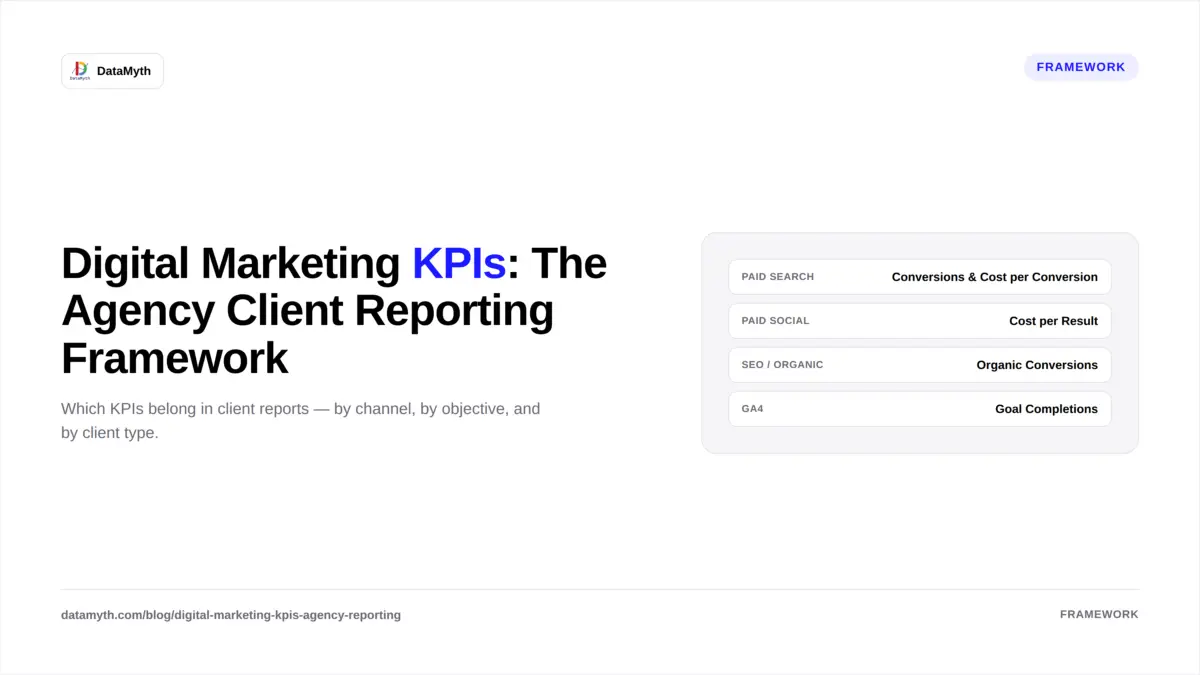
Choosing the wrong digital marketing KPIs for a client report is not a minor formatting issue, it’s a trust problem. When a PPC agency reports impressions to a client who needed leads, or an SEO agency highlights keyword rankings to a client who needed revenue, the report technically shows real data while completely failing to demonstrate value.

This framework maps the right KPIs to the right clients by channel, objective, and business type, so every report you send measures what the client actually hired you to deliver.

What Are Digital Marketing KPIs and Why Do They Vary by Client?

Digital marketing KPIs are the specific, measurable indicators that show whether a marketing activity is achieving its business goal. They vary by client because different clients have fundamentally different objectives. A B2B SaaS company measures qualified leads and pipeline contribution. An e-commerce brand measures ROAS and revenue. A local service business measures calls, form fills, and cost per acquisition.

Reporting the same metrics to all three clients treats their businesses as interchangeable. The framework below sets KPIs by channel and overlays business objective filters.

Which Digital Marketing KPIs Matter by Channel?

Paid Search (Google Ads)

Primary KPIs:

  • Conversions (leads, purchases, or calls, match to objective)
  • Cost per Conversion
  • Conversion Rate
  • ROAS (e-commerce only)

Context KPIs (supporting, not headline):

  • Impression Share
  • Average CPC
  • Quality Score trends
  • Search Term match efficiency

Omit from client-facing reports: Average position (deprecated), click volume without conversion context.

Paid Social (Facebook / Meta, LinkedIn)

Primary KPIs:

  • Results (leads, purchases, whatever the campaign objective is)
  • Cost per Result
  • ROAS (e-commerce)
  • Lead Form Completion Rate (LinkedIn / Meta lead campaigns)

Context KPIs:

  • Frequency (creative fatigue signal)
  • Link CTR
  • Demographic breakdown (LinkedIn-specific)

Omit: Reactions, shares, 3-second video views, reach as a success metric.

SEO / Organic Search

Primary KPIs:

  • Organic Sessions
  • Organic Conversions (or assisted conversions)
  • Revenue from Organic (if tracked)
  • Keyword Ranking Movement (for target terms)

Context KPIs:

  • Click-Through Rate from Search Console
  • Impressions trend (Search Console)
  • Backlinks acquired

Omit: Domain authority as a client-facing performance metric (it’s a diagnostic, not an outcome).

Email Marketing

Primary KPIs:

  • Revenue per Email (e-commerce)
  • Conversion Rate
  • List Growth Rate

Context KPIs:

  • Open Rate (directional, not a success metric)
  • Click-to-Open Rate
  • Unsubscribe Rate

Omit: Raw open rates as headline metric, iOS privacy changes have degraded their accuracy.

Google Analytics / GA4 (Cross-Channel)

Primary KPIs:

  • Goal Completions / Key Events
  • Engagement Rate
  • New vs. Returning Users (by channel)
  • Revenue (if GA4 e-commerce is configured)

Context KPIs:

  • Sessions by Channel
  • Average Engagement Time
  • Landing Page performance

How Should Agencies Set KPIs at the Start of a Client Engagement?

Set digital marketing KPIs at the start of every client engagement using a three-question process:

Question 1: What is the client’s business goal? Leads, revenue, brand awareness, retention, the business goal defines the category of KPI.

Question 2: What does success look like numerically? A 20% increase in qualified leads, a CPL under $80, a ROAS above 3.5x. Without a target, a KPI is just a metric.

Question 3: What data can we reliably track? If conversion tracking is not set up, reporting on conversions is misleading. Confirm tracking integrity before setting KPIs you cannot measure.

Document the agreed KPIs in a shared brief and include them in the first section of every monthly report, so the client always sees current performance measured against the goal they signed off on.

What Is the Difference Between a KPI and a Metric?

A metric is any measurable number, impressions, clicks, sessions, opens. A KPI is a metric that has been selected because it is directly tied to a business goal and has a target. Every KPI is a metric, but most metrics are not KPIs.

This distinction matters for reporting. A report that lists every available metric from every platform is not a performance report, it’s a data dump. A report that shows five agreed KPIs versus their targets, with a written analysis of what drove the variance, is a performance report. The latter earns client trust. The former loses it.

How Do You Build a KPI Dashboard for Reporting?

Build a digital marketing KPI dashboard by:

(1) pulling data from your connected channels automatically,

(2) surfacing only the agreed client KPIs in the headline row,

(3) including period-over-period variance for every KPI, and

(4) adding a written performance narrative.

DataMyth automates steps 1, 2, 3, and 4, connecting GA4, Google Ads, Facebook Ads, LinkedIn Ads, and Search Console in a single report that writes the performance analysis automatically. Visit the DataMyth features page or explore the Google Analytics Report and Google Ads Report tools.

What are digital marketing KPIs?

Digital marketing KPIs are specific, measurable indicators tied to a business goal, such as cost per lead, ROAS, or organic conversions. They differ from generic metrics because they have agreed targets and directly reflect whether marketing is achieving the client’s objective.

How many KPIs should a marketing report include?

Most client reports work best with three to five headline KPIs, enough to cover the primary goal without overwhelming non-marketing stakeholders. Support each headline KPI with two or three context metrics, not the full platform data export.

What are the most important digital marketing KPIs for e-commerce?

For e-commerce, the core KPIs are ROAS, cost per purchase, revenue from paid channels, organic revenue, and conversion rate by channel. These directly link marketing spend to revenue outcomes.

What are digital marketing KPIs for B2B?

For B2B, the primary KPIs are qualified leads, cost per lead, lead-to-opportunity rate (if CRM is connected), and pipeline influenced. Supporting KPIs include campaign CTR, cost per click, and demographic quality data (especially for LinkedIn Ads).

How do you choose KPIs for a new marketing client?

Match KPIs to the client’s stated business goal, set a numeric target for each, and confirm that conversion tracking is in place to measure them accurately. Agree on the KPI set in writing before the first report is sent.

How do digital marketing KPIs differ from vanity metrics?

A KPI is tied to a business outcome and has a target. A vanity metric, like impressions, follower count, or raw page views, can increase while business results decline. The test: if the metric went up while revenue, leads, or conversions went down, it is a vanity metric.

Categories
Marketing

Digital Marketing KPIs Every Agency Should Track (And How to Automate Them)

Every agency tracks metrics, but not every agency tracks the right ones, or explains them clearly enough for a client to act on. This guide breaks down the core digital marketing KPIs worth prioritizing and how automating their reporting saves hours every month.

The Core KPIs Most Agencies Should Track

  • Cost per acquisition (CPA), tracks efficiency of paid spend across Google Ads and Meta Ads campaigns.
  • Click-through rate (CTR), signals ad relevance and creative performance.
  • Return on ad spend (ROAS), ties spend directly to revenue outcomes.
  • Conversion rate, measures how well traffic turns into leads or sales.
  • Organic search visibility, tracked through Google Analytics and Search Console reporting.

Why KPI Selection Matters More Than KPI Volume

Agencies often over-report, cramming dozens of metrics into a single client dashboard, which dilutes focus rather than sharpening it. A smaller set of well-chosen digital marketing KPIs, tied directly to client goals, tends to produce clearer client conversations than an exhaustive metrics dump.

The Manual Reporting Problem

Pulling KPIs from multiple platforms, Google Ads, Meta Ads, LinkedIn Ads, GA4, manually every reporting cycle is repetitive and time-consuming, and it’s exactly the kind of task most prone to human error under deadline pressure.

Automating KPI Tracking and Analysis

Modern reporting platforms connect directly to ad and analytics platforms, pulling KPI data automatically instead of requiring manual exports. DataMyth goes further by pairing each KPI with a written explanation of what drove any change, turning a static KPI table into a report clients can interpret without a follow-up call.

Conclusion

The right digital marketing KPIs, tracked consistently and explained clearly, do more for client retention than a longer metrics list ever will. Automating both the collection and the interpretation of these KPIs is what turns raw numbers into insights clients actually act on.

Categories
Automation Marketing

Unlock The Power Of Data-Driven Marketing

Are you looking to unlock the power of data-driven marketing? Employing data-driven marketing is one of the most beneficial approaches for ascertaining insights about your customers and creating custom, productive strategies. In this blog post, we will explore how data-driven marketing can help you succeed. We’ll discuss what it is, its benefits, how to analyze your audience and craft targeted messaging, automate processes, track results and come to a conclusion. By the end of this post, you will have information needed to start using data-driven marketing in your business!

What Is Data-Driven Marketing?

Data-driven marketing is a modern approach to marketing that leverages various data sources, such as customer interactions, site analytics, and social media insights, to develop marketing strategies. This technique enables marketers to better understand their customers’ behavior & preferences and discover new opportunities for growth. By utilizing data-driven tactics, marketers can create more informed campaigns that have a greater impact on the bottom line. Data-driven marketing also helps with optimizing existing campaigns and measuring the success of past efforts in order to get maximum return on investment.

Analyzing Your Audience

Before you can unlock the power of data-driven marketing, it’s important to understand who your audience is and analyze their behavior. Knowing who your target audience is, what their interests are, and how they respond to different messages will allow you to tailor your communications in a way that will yield better results. Understanding the customers’ buying patterns can also help identify opportunities for growth and discover new areas of focus or strategies that could lead to increased sales. By analyzing your audience’s behavior, you can create more effective campaigns that drive strong ROI for your business.

Crafting Targeted Messaging

Marketing that is driven by data is a powerful asset in today’s digital age. Crafting targeted messaging helps you unlock its full potential allowing you to effectively communicate and reach your target audience. The key to crafting successful messages is understanding who your target market is – their demographics, interests, and pain points – so you can tailor content to match their needs. Once you understand your audience, you can create messages that are meaningful and impactful for them, resulting in higher engagement rates and more conversions. With the right data-driven marketing strategy in place, you’ll be able to successfully reach your desired customers and maximize the effectiveness of your campaigns.

Automating Your Processes

Data-driven marketing is all about utilizing data to make informed decisions and uncover powerful insights, so it makes sense to automate these processes. Automation helps streamline arduous tasks like data analysis, while also reducing human error and freeing up your team’s time to focus on more strategic initiatives. Additionally, automation can help optimize the customer experience by delivering content at precise moments in their journey. Automation is a great way to unlock the power of data-driven marketing – and increase your ROI! This is where tools like DataMyth can help automate data analysis.

Tracking Your Results

Tracking your results is key to unlocking the power of data-driven marketing. Keeping an eye on metrics like visibility, click throughs, leads, sales, ROI, and customer engagement will give you a clear picture of how successful your campaigns are. It’s important to be able to distinguish between what works and what doesn’t—plus identify any areas for improvement. Look for trends in the data that can help inform your future decisions. Doing so will enable you to refine and optimize campaigns for maximum effectiveness.

Conclusion

The conclusion of this article is that data-driven marketing is a powerful approach that can be used by businesses of all sizes to optimize their marketing efforts and reach their target audiences. When leveraged correctly, this type of marketing can help companies create a better customer experience and develop effective marketing strategies. By understanding the core concepts and using available resources such as analytical tools, businesses can unlock the power of data-driven marketing for maximum results.