Categories
Reporting

Marketing Report Examples: What Strong Reports Include (and What Weak Ones Leave Out)

Marketing report examples from strong agencies share a set of structural and content characteristics that are consistently present and consistently absent from reports that underperform on client satisfaction. Looking at what the best reports include, and annotating why it works, is more useful for improving your own reporting than any general advice about “being more strategic.”

This guide breaks down the key sections of strong marketing report examples and examines what makes each one effective.

What Does a Strong Executive Summary Look Like?

The executive summary is the highest-read section of any marketing report and the most commonly wasted. Strong marketing report examples use the executive summary to communicate three things only: the verdict, the primary driver, and the recommendation.

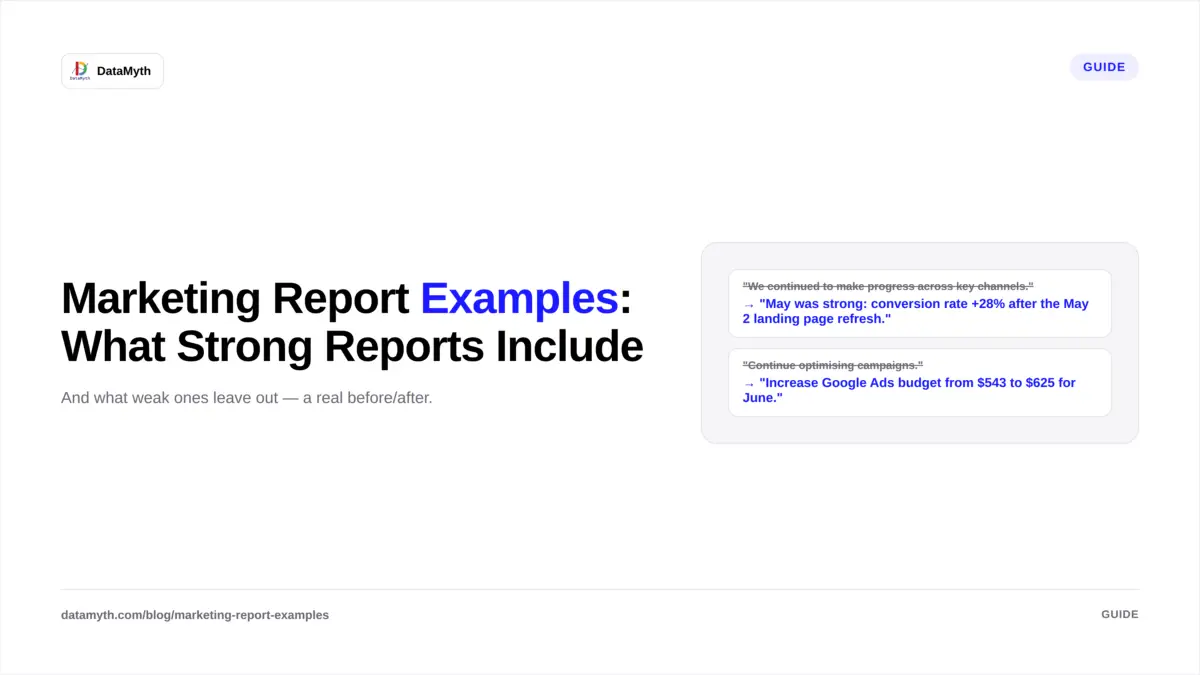
Weak executive summary example: “This month we continued to make progress across the key channels and saw some improvements in performance metrics overall. We are monitoring several areas and will continue to optimise going forward.”

What is wrong: No verdict. No specific data. No recommendation. The client cannot determine from this summary whether the month was good or bad, what caused any change, or what is happening next.

Strong executive summary example: “May was a strong month, driven by a 28% increase in Google Ads conversion rate following the landing page refresh we implemented on May 2nd. Total leads generated reached 47, above the monthly target of 40. Organic traffic continues to grow (up 14% year-over-year) as a result of the four long-form articles published in Q1. For June, we recommend increasing the Google Ads budget by 15% to capitalise on the improved conversion rate while competitive CPCs remain below seasonal average.”

What works: Specific verdict (strong month). Specific cause (landing page refresh, with date). Specific data against target (47 vs target 40). Specific YoY context for organic. Specific recommendation with rationale and timing.

The executive summary should be 150-250 words, specific enough that a client reading only this section understands the period’s performance and the proposed next action.

What Does a Strong Channel Performance Section Look Like?

Marketing report examples with strong channel sections follow a consistent structure: headline metric (large, with comparison), supporting metrics table, trend chart, and written analysis.

Annotated paid search channel section

Headline metric (large KPI tile): Conversions: 47 (vs 38 prior month, +24%)

Supporting metrics table:

MetricThis monthLast monthChange
Impressions124,000118,000+5%
Clicks3,8903,650+6.6%
CTR3.1%3.1%0%
Avg CPC$4.20$4.40-4.5%
Conversions4738+23.7%
Conversion rate1.21%1.04%+16.3%
Cost per conversion$347$430-19.3%
Total spend$16,300$16,340-0.2%

Trend chart: Line chart: Conversions and Cost per Conversion over 12 months (both lines, labelled clearly)

Written analysis (the most important part): “Conversion rate improved from 1.04% to 1.21% this month, driving 9 additional conversions at effectively the same spend level. The primary driver was the updated landing page launched May 2nd, which improved form completion by 18% in the first two weeks. CTR was flat month-over-month, suggesting the ad copy is performing consistently, no creative refresh is needed this cycle. CPC decreased slightly as two higher-bid competitors appear to have reduced spend, creating more efficient auction conditions. We will monitor CPC in June as seasonal competition typically increases in the second half of the year.”

What makes this analysis strong: it attributes the improvement to a specific cause (landing page, with date), quantifies the specific improvement, explains what did not change and why (flat CTR, no action needed), and identifies an emerging risk (seasonal CPC increase) to monitor.

What Does a Strong Recommendations Section Look Like?

Marketing report examples that drive strong client trust include a recommendations section that is specific, data-backed, and forward-looking. Weak recommendations sections are vague or absent entirely.

Weak recommendations:

  • “Continue optimising campaigns”
  • “Test new creative”
  • “Monitor performance”

These are not recommendations. They are descriptions of what an agency always does.

Strong recommendations:

Recommendation 1: Increase Google Ads daily budget from $543 to $625 for June. Rationale: Conversion rate improved 16% in May with no increase in spend. Budget increase will capture additional conversion volume while the improved rate persists. Current search impression share is 68%; budget increase will address the 32% of eligible queries currently missed. Expected outcome: Projected 12-15 additional conversions at the improved CPL of $347. Action required: Client approval for budget increase.

Recommendation 2: Publish two additional blog articles targeting [keyword cluster] in June. Rationale: The four articles published in Q1 have produced 14% YoY organic traffic growth. The next topic cluster in the content calendar (identified in Q1 strategy session) targets queries with 2,400 monthly search volume and no current ranking content. Expected outcome: Initial ranking signals within 30-60 days; traffic contribution visible in August reporting. Action required: Agency writing, client review for factual accuracy.

Strong recommendations include: what to do, why (with specific data), expected outcome, and who needs to do something. Each recommendation is actionable within the next reporting period.

What Does Good Written Analysis Look Like in a Marketing Report?

Across marketing report examples from high-performing agencies, the written analysis follows a consistent pattern:

What changed: One sentence naming the metric and the direction of movement. “Organic sessions from branded search increased 32% month-over-month.”

Why it changed: One to two sentences attributing the cause. “The increase correlates with the LinkedIn thought leadership campaign that ran from May 5-20, which generated 2,400 new profile visits and 140 website clicks from LinkedIn directly.”

What it means: One sentence connecting the data to the client’s goal. “This suggests the awareness campaign is building brand recognition among the target professional audience and driving them to research the brand directly.”

What happens next: One sentence forward-looking. “We expect this trend to continue through June as the LinkedIn campaign continues, with a potential plateau in July when the campaign budget resets.”

This four-sentence framework applies to every metric section in the report. It takes 3-4 minutes per metric section to write and transforms the report from a data delivery into an analytical service.

How Do You Handle Negative Results in a Marketing Data Presentation?

Presenting marketing data that shows underperformance is the moment that most separates strong agencies from weak ones. The instinct is to minimise the bad news, lead with positive metrics, bury the underperformance in a secondary section, or frame it as “an area of opportunity.”

The correct approach is the opposite: acknowledge the underperformance directly in the executive summary, explain the cause specifically, and present a corrective action with a timeline.

A client who reads a report that honestly presents a difficult month and provides a clear explanation and action plan trusts the agency more, not less. The trust damage comes not from the bad result but from discovering that the agency knew about the problem and did not say so.

The language for presenting underperformance should be direct but not catastrophising: “Cost per lead increased 32% month-over-month, driven by [specific cause]. We are implementing [specific action] to address this, with results visible in the June reporting cycle.” Specific, owned, forward-looking.

DataMyth generates this four-part analysis automatically for each channel’s performance data, producing the written narrative as a starting draft that the account manager reviews and refines. The time saving is substantial — from 60-90 minutes of analysis writing per client to 15-20 minutes of review and editing. See DataMyth’s written analysis generation.
Categories
Reporting

Google Ads Performance Report: How to Build One That Non-Technical Clients Understand

A Google Ads performance report that is built for an account manager to review internally and a Google Ads performance report built for a client to read are two very different documents. The internal version can show Quality Scores, impression share breakdowns, bid modifier performance, and auction insights. The client-facing version should show whether the investment is producing the business outcomes the client cares about, with enough context to explain why.

Most agencies produce a version somewhere between the two: too much data for an executive but not enough for an analyst. This guide covers how to build a Google Ads performance report that communicates clearly at the client level without hiding the analysis that informs the agency’s work.

What Metrics Belong in a Google Ads Performance Report?

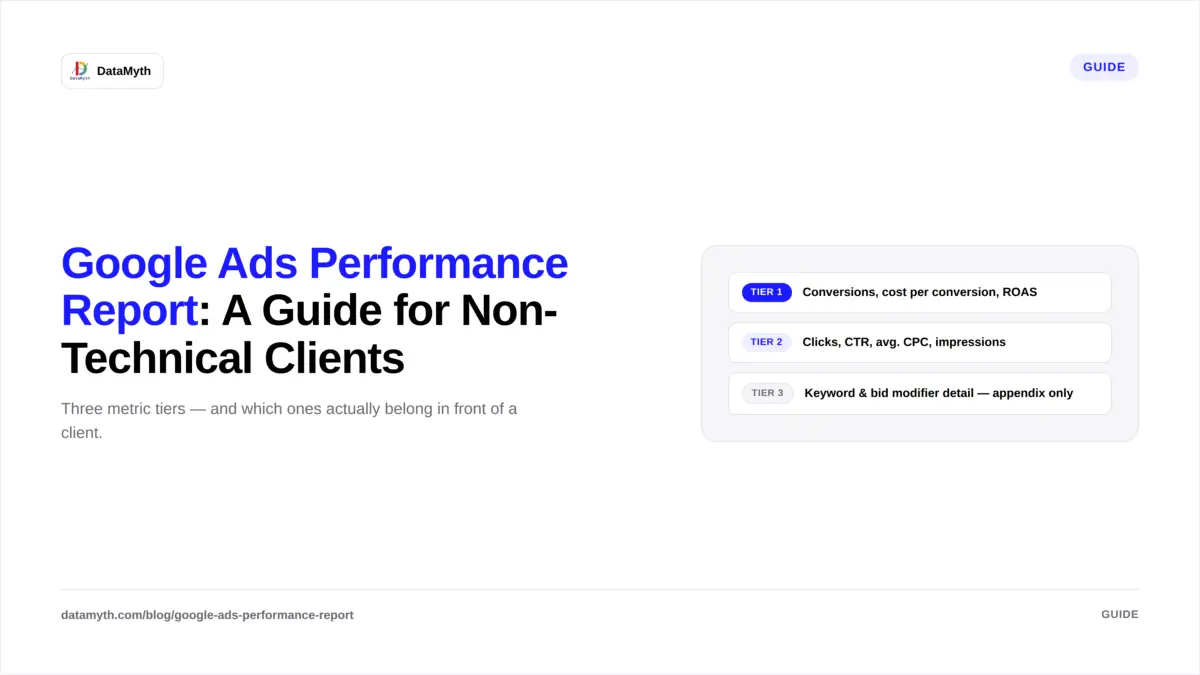
A client-facing Google Ads performance report should include metrics in three tiers: headline business metrics, channel efficiency metrics, and diagnostic metrics.

Tier 1: Headline business metrics (most prominent)

These are the metrics that directly answer “is this investment worthwhile?” They belong in the KPI tile section of the report and carry the highest visual weight.

MetricWhat it answersClient-facing label
ConversionsDid the campaign produce the goal event?Leads generated / Purchases / Bookings
Cost per conversionHow much did each result cost?Cost per lead / Cost per purchase
Revenue (ecommerce)How much revenue did the campaign produce?Revenue from Google Ads
ROAS (ecommerce)Did the spend return more than it cost?Return on ad spend
Conversion rateOf all clicks, how many converted?Click-to-conversion rate

Tier 2: Channel efficiency metrics (supporting)

These metrics provide context for the headline figures and explain the mechanism. They belong in the channel performance table, visible but not dominant.

MetricWhat it explains
ClicksVolume of traffic produced
CTRHow well the ads attract clicks for the queries shown
Average CPCCost of each click
ImpressionsHow often the ads appeared
Average position / Impression shareHow visible the campaign is in auction
Quality ScoreAd relevance and landing page quality (weekly check, not monthly report)

Tier 3: Diagnostic metrics (internal or appendix only)

Keyword-level performance, match type breakdowns, device bid modifier analysis, audience modifier performance. These are the metrics the agency uses to make optimisation decisions, not the metrics the client needs to evaluate the campaign’s business performance.

Including Tier 3 metrics in the main body of a client report adds complexity without adding client understanding. Move them to an appendix or keep them in internal analysis documents.

How Do You Frame Google Ads Data for Non-Technical Clients?

Google Ads performance report data requires translation for non-technical clients. The four most common translation challenges:

CTR. Clients often interpret a CTR below 5% as underperformance. The context: average CTR on Google Search is 6.11% across all industries (WordStream, 2024), but varies from 3.8% for legal services to 10.7% for arts and entertainment. The agency’s role is to provide the industry-specific benchmark, not just the number.

Impression share. “We achieved 72% impression share” means nothing to most clients. “Our ads appeared for 72% of the searches where they were eligible — the remaining 28% were missed due to budget limits” is clear and creates an actionable conversation about budget.

CPC. Average CPC varies from under $1 in some categories to $50+ in legal and financial services. Present CPC with the industry context: “Our average CPC of $8.40 is below the industry average of $11.20 for this category.”

Quality Score. Quality Score drives CPC and position but is a metric most clients do not understand without explanation. Consider including a brief explainer the first time it appears: “Quality Score (1-10) measures Google’s assessment of ad relevance and landing page quality. Higher scores reduce our cost per click. We are currently averaging 7/10, above the 5/10 baseline.”

How Should a Google Ads Performance Report Be Structured?

A complete Google Ads performance report for monthly client delivery:

Page 1: Executive summary Verdict on the month, primary driver of performance (positive or negative), and the top recommendation for the next period.

Page 2: Headline KPI tiles The Tier 1 metrics at large visual weight: conversions, cost per conversion, and ROAS or revenue for ecommerce accounts.

Page 3: Channel performance table and trend Tier 2 metrics in a table with period comparisons. Line chart of conversions and cost per conversion over the past 6-12 months. Written analysis of what drove the period’s performance.

Page 4: Campaign-level performance breakdown Which campaigns performed strongest, which underperformed, and why. This page connects the account-level story to the specific campaign decisions.

Page 5: Recommendations for next period Three to five specific, data-backed recommendations with expected outcomes.

Appendix (optional): Full keyword and ad-level data For clients who want detailed access to the underlying data. Labelled clearly as supplementary.

According to Google’s 2024 benchmark data, campaigns with a clear documented optimisation log (recording changes made and their measured impact) show 28% better performance improvement over 12 months than campaigns managed without systematic documentation. Including a “changes made this month” section in the Google Ads performance report serves both the client and the agency’s own optimisation discipline.

How Do You Automate Google Ads Performance Reporting?

Manual Google Ads performance report production involves: logging into Google Ads, setting the date range, selecting the metrics, exporting the data, cleaning and formatting it, building the charts, and writing the analysis. For 10 clients, this is 15-25 hours per month.

DataMyth automates this process by connecting to Google Ads via API, extracting the Tier 1 and Tier 2 metrics automatically each reporting cycle, and generating the structured report with written analysis of what changed and why. The account manager’s role becomes: reviewing the generated analysis, adding campaign-specific context (what changes were made and why), and writing the recommendations section.

This reduces the Google Ads reporting cycle from 90-150 minutes per client to 15-25 minutes. Connect Google Ads to DataMyth.

What Is the Right Reporting Cadence for Google Ads?

Google Ads performance report cadence should match the client’s campaign budget and the decision-making cycle. Three practical guidelines:

Monthly reporting is the standard for most clients. Monthly cycles provide enough time for meaningful performance changes to accumulate and enough data to draw statistically reliable conclusions about what is and is not working.

Weekly reporting is appropriate for high-budget campaigns (over $30,000/month spend) where performance variations can compound quickly, for ecommerce campaigns during peak seasons (Black Friday, holiday period), or when a significant campaign change is under active evaluation and requires fast feedback.

Bi-weekly reporting is a useful middle ground for clients who want more visibility than monthly but do not have the budget level to justify weekly. A bi-weekly cadence for the primary KPI metrics (conversions, CPL, spend pace) with a full monthly report covers most needs.

For most campaigns, a monthly report with a weekly performance alert system (automated alerts when conversions drop below threshold or CPC spikes above threshold) provides the right balance of regular visibility and strategic reporting depth.

What metrics should a Google Ads performance report include?

Tier 1 (headline): conversions, cost per conversion, ROAS, revenue. Tier 2 (supporting): clicks, CTR, average CPC, impressions, impression share. Tier 3 (internal/appendix only): keyword performance, bid modifier analysis. Most clients need Tier 1 and 2; Tier 3 is for the agency’s optimisation work.

How do I explain CTR to a non-technical client?

Provide the industry benchmark alongside the client’s number: “Our ads clicked 6.8% of the time they appeared, compared to the industry average of 4.2% for our category.” Context makes the number meaningful.

How should I structure a Google Ads client report?

Executive summary, headline KPI tiles, channel performance table and trend chart, campaign-level breakdown, and recommendations. Detailed keyword and ad-level data goes in the appendix for clients who want it.

What is impression share and how do I explain it to clients?

Impression share is the percentage of eligible searches where your ads appeared. “We appeared for 72% of relevant searches; the remaining 28% were missed due to budget limits” is the client-ready version.

How do I automate Google Ads reporting for multiple clients?

Connect your clients’ Google Ads accounts to DataMyth, which extracts the data automatically each cycle and generates the formatted report with written analysis. This reduces 90-150 minutes of manual work per client to 15-25 minutes of review.

Should I include Quality Score in a client report?

Not as a headline metric, but it can be included in the supporting table with a brief explanation. Quality Score is most useful as an internal diagnostic. Include it only if it is relevant to a specific conversation about CPC or position trends.

Categories
Marketing

How to Present Marketing Data to Clients: A Practical Guide to Turning Numbers Into Decisions

How to present marketing data to clients is a skill that most agencies develop by trial and error over years of client calls where the client asked “but what does this mean?” or “what should we do about this?” after receiving a report. The pattern in those questions is always the same: the data was present, but the interpretation and the action were missing.

Knowing how to present marketing data clearly is what separates an agency that delivers reports from an agency that delivers decisions. This guide covers the specific practices, narrative structure, chart selection, language choices, and data hierarchy, that make marketing data immediately useful to the clients who receive it.

Why Is Presenting Marketing Data Difficult?

Most marketers are more comfortable with data than their clients are. The gap creates a communication challenge: the metrics that feel intuitive to an experienced practitioner (ROAS, engagement rate, impression share) feel opaque to a business owner or CFO evaluating whether their marketing investment is working.

Presenting marketing data effectively requires translating from the language of the platform to the language of the client’s business goal. A retail CFO does not care what impression share means, they care whether the campaign is producing profitable sales. A B2B founder does not care what average session duration means, they care whether the content is producing qualified leads.

The translation is the agency’s job. The client should not have to do it themselves.

What Narrative Structure Works for Marketing Data Presentations?

How to present marketing data effectively follows a consistent narrative structure, regardless of whether the presentation is a written report, a slide deck, or a call:

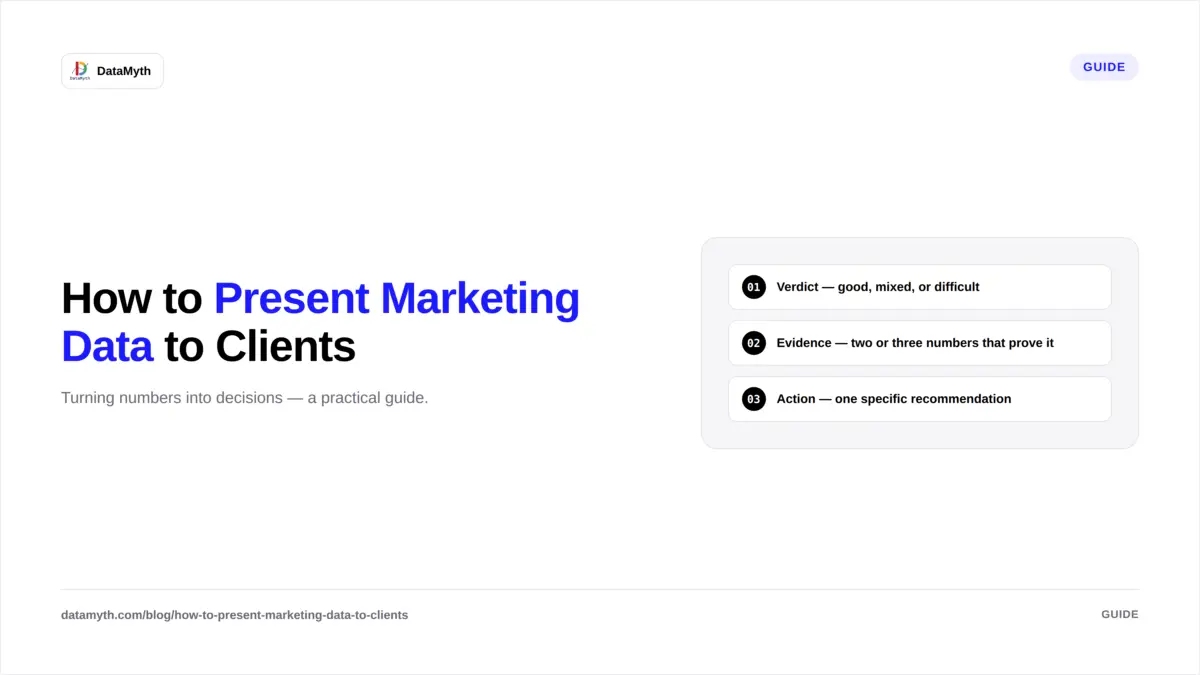
Structure 1: Verdict — Evidence — Action

  1. Verdict: What was the result of the period? Good, mixed, or difficult — and why in one sentence.
  2. Evidence: Which specific metrics support the verdict? Show the two or three numbers that prove the statement, with period comparison.
  3. Action: What should change as a result? One specific, testable recommendation.

This structure works because the client learns the conclusion before the data, which means they process the data as confirmation of something they already understand rather than as a puzzle they are assembling.

Structure 2: Problem – Cause – Solution

Use this structure for report sections where performance underperformed:

  1. Problem: Cost per lead increased 32% month-over-month.
  2. Cause: Average keyword position dropped from 2.1 to 3.6 due to increased competitor bidding on our top three keywords.
  3. Solution: We are raising bids on the three affected keywords by 15% and adding two alternative keywords that show strong volume at lower competition.

This structure demonstrates analytical depth (the cause, not just the symptom) and proactive management (the solution is already in progress, not pending).

How Do You Choose the Right Chart for Marketing Data?

Chart selection is the most commonly made error in how to present marketing data to clients. The wrong chart type makes data harder to understand even when the data itself is correct.

Data to showRight chartWrong chart
Performance over time (trend)Line chartBar chart, pie chart
Comparison across categoriesHorizontal bar chartPie chart, area chart
Single key metric vs targetKPI tile / gaugeLine chart with cluttered context
Channel breakdown by volumeHorizontal bar chartPie chart
Funnel stages (conversion rates)Funnel chart / waterfallPie chart, line chart
Geographic performanceMap or ranked tablePie chart

The pie chart problem: Pie charts require the viewer to estimate the angular difference between segments to compare them, a task humans do very poorly. A horizontal bar chart showing the same category breakdown allows immediate visual comparison of lengths. For almost all marketing data use cases, a bar chart or table is more readable than a pie chart.

The cluttered line chart problem: Line charts with more than five data series become unreadable. If you need to show seven channels’ performance trends simultaneously, use a table with conditional formatting (green for positive trend, red for negative) rather than a seven-line chart.

How Do You Translate Technical Marketing Metrics Into Business Language?

The core skill in how to present marketing data is translation. Specific translation examples:

Technical metricClient-facing translation
CTR: 4.2%“4.2% of people who saw the ad clicked it, above average for this sector”
Impressions: 450,000“Your ads appeared 450,000 times to potential customers this month”
Engaged sessions: 12,400“12,400 visitors spent meaningful time on the site, reading content, viewing products, or completing a goal”
ROAS: 4.2“For every $1 spent on Google Ads, $4.20 in revenue was attributed to those campaigns”
Impression share: 68%“Your ads appeared in 68% of relevant searches; 32% were missed, mainly due to budget limits”
Quality Score: 7/10“Google rates our ad and landing page quality at 7 out of 10, which means we are paying less per click than lower-scored competitors”

The translation pattern: explain what the metric measures in one sentence, provide the client’s number, give the directional verdict (above/below average, improving/declining), and connect it to a business outcome where possible.

How Does DataMyth Help Present Marketing Data?

How to present marketing data clearly is a core function of DataMyth’s reporting platform. DataMyth generates written analysis that translates each metric movement into a business narrative, explaining what changed, attributing a cause, and contextualising against prior period performance. The account manager reviews and refines this analysis rather than writing it from scratch.

The report output formats (PDF, shareable link) are structured to follow the verdict-evidence-action narrative structure, with headline KPI tiles at the appropriate visual weight and channel sections following the consistent hierarchy that makes data easy to navigate. See DataMyth’s reporting output.

What Should You Avoid When Presenting Marketing Data?

Avoid jargon without explanation. The first time any technical term appears in a client-facing report, include a one-sentence definition in parentheses. Thereafter it can stand alone.

Avoid presenting every available metric. Twelve metrics per channel section is too many. Prioritise the five or six that directly answer whether the campaign is working. Additional metrics move to the appendix.

Avoid positive spin that hides problems. A report that leads with high impressions when conversion rate dropped significantly is presenting the right data in the wrong order. Lead with the verdict, not the most flattering metric.

Avoid no recommendation. Data presented without a recommended action is a description, not strategic reporting. Every report section should end with “therefore we recommend…” or the equivalent.

How Do You Present Marketing Data in a Live Client Call?

How to present marketing data in a live call differs from a written report because the client can ask questions in real time, and the order of information matters more. Practical guidance:

Start with the verdict before sharing the screen. Before opening the report, state the verdict verbally: “May was a strong month, conversions were up 24% and cost per lead dropped significantly. I want to walk you through what drove this and what we are doing in June.” The client now processes the data as confirmation, not as a puzzle they are assembling.

Share the executive summary first. Walk through each line of the executive summary rather than jumping to the detailed channel sections. The summary provides the structure; the detailed sections answer follow-up questions.

Let the client see the data before explaining it. When transitioning to a chart or table, give the client 10-15 seconds to review the visual before narrating it. Clients who have processed the data themselves are more engaged with the explanation than clients who hear the narrative while still scanning the numbers.

End every section with the action. After narrating each channel’s performance, close with: “Based on this, in June we are going to [specific action].” This moves the conversation from review to decision-making, which is where the agency earns its strategic value.

Categories
Reporting

GA4 Custom Report: How to Build the Layout Your Clients Actually Need

A GA4 custom report is the difference between pulling the data GA4 shows you by default and pulling the data your client actually needs to make decisions. Default GA4 reports are designed for broad utility, they cover common use cases for many types of users. Custom reports are designed for a specific client’s specific questions: which channels drive their highest-converting sessions, which pages are entry points for their paid traffic, which devices show conversion rate anomalies.

This guide covers the GA4 custom report building process from the Explore interface through to the filter and dimension combinations that produce the most useful client reporting data.

What Is a GA4 Custom Report and Why Do Agencies Need It?

A GA4 custom report (built using GA4’s Explore tool) is a report layout that you define — choosing the specific dimensions, metrics, and filters that answer a specific question, rather than using GA4’s standard pre-built reports.

Standard GA4 reports are useful for quick checks but limited for client reporting because:

  • They cannot be saved and reused in the same configuration across sessions
  • They do not support all dimension and metric combinations
  • They cannot be directly shared with clients through a persistent link
  • They display GA4’s default metric selection, not the specific metrics relevant to each client’s goals

Custom reports (explorations) solve all four problems: they are saved, configurable, shareable, and entirely controlled by the analyst.

What Types of GA4 Custom Reports Should Agencies Build?

Three GA4 custom report types cover the vast majority of agency client reporting needs:

Free-form exploration (most flexible)

The free-form exploration allows you to configure a table or chart with any combination of dimensions and metrics available in GA4. This is the right format for: channel-level acquisition analysis, landing page performance analysis, conversion path analysis, and device-specific performance breakdowns.

Funnel exploration

The funnel exploration maps user progress through a defined sequence of steps, for example, from the paid ad landing page through to the checkout confirmation page. This is the right format for: ecommerce checkout funnel analysis, lead generation form completion analysis, and content engagement funnel analysis.

Segment overlap

The segment overlap exploration shows the intersection of two or three audience segments. This is the right format for: understanding which channel’s audience also converts on email, which device segment shows the highest purchase rate, and which geographic segment has the strongest engagement with specific content.

How Do You Build a GA4 Free-Form Custom Report for Client Reporting?

The step-by-step process for building a GA4 custom report using the free-form exploration:

Step 1: Open Explore In GA4, navigate to Explore from the left sidebar. Click the blank exploration template or use the template gallery for a starting point.

Step 2: Set the date range Set the reporting period (typically the current month and the prior month for comparison) in the top left of the Explore panel. Always verify this date range before adding any data — the most common GA4 custom report error is generating the correct report for the wrong date range.

Step 3: Add dimensions to the Rows section Drag the dimensions you need from the Variables panel to the Rows section. For a channel performance report: Session default channel group. For a landing page report: Landing page + query string. For a campaign report: Session campaign, Session source/medium.

Step 4: Add metrics to the Values section Drag the metrics that answer your client’s questions from the Variables panel to the Values section. Core metrics for most client reports:

MetricWhat it shows
SessionsVolume of visits
Engaged sessionsQuality visits (10+ sec, 2+ pages, or conversion)
Engagement rate% of sessions that were engaged
ConversionsGoal completions (confirm which events are marked as conversions)
Conversion rateConversions as % of sessions
Revenue (ecommerce only)Direct revenue attribution

Step 5: Add filters for relevance If the report should show only paid traffic, add a filter for Session medium = cpc. If it should show only a specific country or device type, filter accordingly. Filters in GA4 custom reports are applied to all data in the exploration, they are powerful but easy to forget, which causes the most confusing data discrepancies.

Step 6: Save the exploration Explorations are automatically saved to your GA4 account and accessible from the Explore hub. Name each exploration clearly: “[Client Name], [Report Type], [Date Created].”

What Dimensions and Metrics Work Best for Client Reporting?

GA4 custom report dimension and metric combinations for specific client reporting use cases:

Report typeKey dimensionsKey metrics
Channel acquisitionSession default channel groupSessions, Engaged sessions, Conversions, Conv. rate
Landing page performanceLanding page + query stringSessions, Bounce rate, Engagement rate, Conversions
Campaign performanceSession campaign, Session sourceSessions, Conversions, Cost (if imported), ROAS
Geographic performanceCountry, RegionSessions, Conversions, Revenue
Device performanceDevice categorySessions, Engagement rate, Conversions, Conv. rate
Content engagementPage title, Page pathViews, Avg. engagement time, Scroll depth

How Do You Share a GA4 Custom Report With Clients?

GA4 custom reports (explorations) can be shared with other users who have access to the same GA4 property in two ways:

Share within GA4: Open the exploration and use the share icon to share the exploration URL with another GA4 user on the property. They access it with their own GA4 login.

Export to Looker Studio: Link the GA4 property to Looker Studio (formerly Data Studio) and recreate the custom report as a Looker Studio report. This can then be shared as a view-only link that the client can access without a GA4 account.

For most agency-client reporting workflows, the best approach is to use GA4 custom explorations as the data source for internal analysis and build the client-facing report from the exported data in a formatted report document or an automated reporting tool.

DataMyth connects to GA4 directly and pulls the relevant data automatically, applying the same dimension and metric configuration every cycle. This means the GA4 custom report configuration is a one-time setup rather than a monthly manual rebuild. Connect GA4 to DataMyth.

What Are the Most Common GA4 Custom Report Mistakes for Agencies?

Wrong date range. The most common error. Check the date range before exporting any data. A report with the correct metrics but the wrong date range is factually incorrect.

Confusing sessions with users. Sessions count visits (one user can generate multiple sessions). Users count unique individuals. Depending on the question, one may be more relevant than the other. Establish which metric the client’s report uses as the primary traffic indicator and apply it consistently.

Not verifying conversion event setup. GA4 custom reports show conversions only for events that are marked as Conversions in Admin > Events. If the form submission event is not marked, it will not appear in conversion metrics in any report. Always verify conversion event configuration before the first report.

Forgetting applied filters. If you set a filter for device = mobile in a previous session and do not remove it before saving a new exploration, every report built in that session will show mobile-only data. Review applied filters before saving any exploration.

Categories
Reporting

Marketing Report Template: How to Build One That Actually Gets Used

A marketing report template that is built correctly is one of the highest-leverage investments an agency or in-house team can make. Build it once, maintain it quarterly, and use it for every client, every month. Fail to build it thoughtfully and every reporting cycle involves rebuilding structure from scratch, reformatting data to fit a layout that does not quite work, and sending something that looks slightly different from last month’s version.

This guide covers exactly what a marketing report template needs to include, how to structure the channel data sections, and when a custom-built template should be replaced with an automated reporting platform.

What Is a Marketing Report Template?

A marketing report template is a pre-structured document that defines the layout, sections, visual hierarchy, and data organisation for every marketing performance report. It is the scaffold that holds the changing data each month without requiring the account manager to rebuild the document structure from scratch.

The template is not the report, it is the repeatable container into which the month’s data and analysis are placed. A good template makes producing a high-quality report faster without making all reports look generic.

What Sections Must Every Marketing Report Template Include?

A complete marketing report template for a client-facing marketing report contains these sections, in order:

Section 1: Executive Summary

One page maximum. Contains: the verdict on the period (strong, mixed, or difficult, with specific reasons), the two or three most important findings, and the top recommendation for the next period. This section is written fresh every month; the template defines the structure, not the content.

Section 2: Headline KPI Tiles

Four to six large-format KPI indicators showing the most important metrics at a glance. Each tile should show: the metric name, the current period value, the prior period value, and the percentage change. Use green/red or up/down arrows for direction, not colour alone (colour-blind accessibility).

For an ecommerce client, the headline KPI tiles might be: Total Revenue, ROAS, Cost per Purchase, Sessions from Paid, Organic Sessions, and Conversion Rate.

For a B2B SaaS client: MQLs, Cost per MQL, Demo Requests, Trial Sign-ups, Organic Branded Search Clicks, and Customer Acquisition Cost.

Section 3: Channel Performance Sections

One section per active channel. Standard structure for each channel section:

Sub-elementContent
Channel headline metricThe single most important metric for this channel, large
Supporting metrics table5-8 metrics with current period, prior period, and change
Performance trend chartLine chart showing the headline metric over 6-12 months
Written analysis2-3 paragraphs: what changed, why it changed, what the trend means

Channel sections typically include: Paid Search, Paid Social, Organic Search, Email (if applicable), and Direct/Other. Each section uses the same structure so the client can navigate to any channel and immediately find the information in the same place.

Section 4: Recommendations

Three to five specific, actionable recommendations for the next period. Format:

Recommendation: What should be done Rationale: Why — supported by specific data from this report Expected outcome: What result it should produce Owner: Agency, client, or shared

Section 5: Data Appendix (Optional)

Full channel data tables for clients who want access to detailed numbers beyond the summary view. This section is optional and should be clearly labelled as supplementary data, not part of the primary report narrative.

How Do You Structure Channel Data in a Marketing Report Template?

Marketing report template channel data structure follows a hierarchy principle: summarise first, detail second.

For each channel, the template shows the most important metric at the top (largest visual element), followed by a table of supporting metrics, followed by a chart of the trend, followed by the written analysis. This structure means the account manager fills in the same positions every month, and the client reads in the same direction every month.

Data table format for each channel:

MetricThis monthLast monthChange (%)YoY change (%)
Primary metric[value][value][%][%]
Secondary metric 1[value][value][%][%]
Secondary metric 2[value][value][%][%]

Always include both month-over-month and year-over-year comparisons. For clients in seasonal industries, YoY context is often more meaningful than MoM, a 30% traffic drop in January following a retail peak in December is not an alarming signal unless it is 30% worse than January of the prior year.

What Design Principles Apply to a Marketing Report Template?

A marketing report template that is well-designed requires less reading effort from the client, which directly increases how thoroughly the report is read and how much of the agency’s analysis is absorbed.

Four design principles:

Consistent visual hierarchy. The most important element on each page is visually largest. Section headers are consistent in size and style. Chart titles are consistent in weight and position.

Minimal colour use. Two to three colours maximum: your brand primary, your brand secondary, and a neutral. Use colour for emphasis (KPI tiles, chart lines) and white/neutral for backgrounds and text.

Charts matched to data type. Line charts for trends, bar charts for comparisons, single numbers for headline KPIs. Never use pie charts for marketing data — the mental calculation required to compare segments is harder than reading a bar chart.

White space is not empty space. Padding around metrics, spacing between sections, and margins on page edges all make the report easier to read. A dense report filled edge to edge is harder to process than a spacious one, even when the content is identical.

When Should You Replace a Custom Template With an Automated Reporting Tool?

A custom marketing report template is appropriate when: you have a single client with specific requirements, you have a dedicated designer, or the reporting volume is low enough that manual production is not a significant time burden.

Replace it with an automated reporting tool when: you have more than three clients receiving regular reports, manual production is taking more than 2-3 hours per client per month, or data errors in manually assembled reports are causing client trust issues.

DataMyth provides a structured template framework that connects directly to your client’s channels (GA4, Google Ads, Facebook Ads, LinkedIn, Search Console) and populates each section automatically — KPI tiles, channel performance tables, trend charts, and written analysis — without manual data extraction or formatting. Start with DataMyth’s report template.

The time to switch is earlier than most agencies think. The cost of a manual reporting workflow — in time, in errors, and in inconsistency — accumulates quickly across even a small client roster.

How Often Should a Marketing Report Template Be Updated?

A marketing report template should be reviewed quarterly and updated when:

  • A new channel is added to the client’s marketing mix
  • A significant GA4 or platform update changes available metrics
  • The client’s primary business goals change (which changes the headline KPI tiles)
  • Feedback from clients indicates a section is unclear or underused

Annual major reviews are appropriate for established templates. The goal is a living document that evolves with the client’s business, not a static structure that becomes misaligned over time.

Categories
Marketing

How to Choose a Marketing Analytics Platform in 2026

Every marketing team needs a marketing analytics platform, a place where data from every channel is gathered, organized, and made useful. The problem is that “marketing analytics platform” now describes three very different categories of software: data visualization tools, reporting automation tools, and AI-driven insight platforms. Choosing between them requires being clear about what problem you actually have.

This guide defines the categories, sets out seven evaluation criteria, and gives agencies and in-house teams a framework for picking a platform that fits what they need now, not what looks impressive in a demo.

What Is a Marketing Analytics Platform?

A marketing analytics platform is software that connects your marketing data sources, aggregates the data in one place, and presents it in a structured format for analysis and reporting. Beyond that definition, platforms diverge significantly:

  • Data visualization tools (Looker Studio, Tableau): powerful for building custom dashboards but require manual analysis. They show you what happened; they do not explain why.
  • Reporting automation platforms (DashThis, AgencyAnalytics): automate data pulling and report formatting. They remove the manual export step but still leave the written analysis to you.
  • AI-driven insight platforms (DataMyth): automate the data pull, the formatting, and the written performance analysis, identifying what changed, why, and ranking causes by degree of impact.

Most buyers start by comparing price and integrations. The more useful comparison is: where in the reporting workflow does this tool stop helping you?

What Are the Key Criteria for Choosing a Marketing Analytics Platform?

Evaluate a marketing analytics platform against these seven criteria before committing:

1. Integration coverage. Does it connect to the channels you actually use? Core integrations to require: GA4, Google Ads, Facebook Ads, LinkedIn Ads, Google Search Console. If you use HubSpot, Shopify, or email platforms, confirm those connections too. An analytics platform is only as useful as the data it can access.

2. Written analysis vs. raw data. Does the platform interpret the data or just display it? Tools that produce charts and tables require you to write the analysis. Tools that generate written performance narratives, explaining what changed and why, recover hours of agency time per client per month. This is the most consequential difference between categories and the one most often overlooked in demos.

3. White-label capability. For agencies, white-labeling is non-negotiable. Every client-facing report should carry the agency’s brand. Confirm whether white-labeling is included in the base plan or gated behind higher tiers.

4. Scheduling and automation. Can the platform generate and deliver reports automatically on a set cadence? Manually triggering reports every month defeats the purpose of a reporting tool. Scheduling should be configurable by client, with different cadences for different accounts.

5. Multi-account management. Agencies managing 20+ clients need a platform designed for account-level management, not a tool that requires a separate login per client. Confirm that the platform surfaces all accounts in one view and supports bulk operations.

6. Pricing model alignment. Per-client pricing scales badly for agencies. Per-seat pricing is opaque when teams grow. Look for pricing models that align with how you actually work, flat-rate with unlimited reports and accounts is the cleanest for agencies.

7. Time-to-first-report. How long does it take to go from sign-up to first client report? If onboarding takes two weeks and requires developer support, the platform will be underused. The fastest tools connect channels and generate a first report in under an hour.

How Is a Marketing Analytics Platform Different from a Dashboard Tool?

DimensionDashboard tool (e.g., Looker Studio)Marketing analytics platform (e.g., DataMyth)
Data connectionManual or semi-automatedAutomated, OAuth-based
Report formatVisual charts; you design the layoutPre-built templates by channel
Written analysisNone, you write itAutomated, generated with the report
White-labelLimited or requires workaroundsNative, per-client
SchedulingNone nativeScheduled delivery by cadence
PricingFree (Looker Studio) or per-seatPer account or flat-rate
Learning curveHigh (requires template-building skill)Low (connect and generate)
Best forAnalysts who want full controlAgencies and teams who want reporting done

The clearest signal for which category you need: if you spend more than two hours per client per month writing commentary on your own charts, you need a platform that writes it for you. If you have a dedicated analyst who enjoys building custom views, a visualization tool gives more flexibility.

What Should Agencies Look for That In-House Teams Don’t?

Agencies evaluating a marketing analytics platform have requirements that in-house teams don’t:

  • Multi-client architecture: One interface showing all client accounts, each with separate templates, schedules, and branding. Not a per-account login.
  • Scalable pricing: Adding the 25th client should not require a call with sales or a pricing negotiation. Confirm upfront.
  • White-label everything: Not just the report logo, the report URL, the PDF export filename, and any client-facing interface.
  • Consistent output across accounts: Every client report should look professionally consistent, not like a different team member did each one.
  • Written analysis that saves account-manager time: The written narrative is the highest-effort part of reporting. Automating it is what lets an agency scale from 15 to 30 clients without hiring another account manager.

How Much Does a Marketing Analytics Platform Cost?

Marketing analytics platform pricing ranges from free (Looker Studio, which requires full self-service) to $50–$400/month for mid-market tools depending on accounts, users, and features. For agencies:

  • Tools that charge per-client: pricing scales with your client count, which is the worst model for growing agencies
  • Tools with flat-rate unlimited accounts: predictable cost regardless of how many clients you add
  • Enterprise tools: custom pricing, often negotiated annually

DataMyth offers a 7-day free trial with no credit card required. See DataMyth pricing for current plan details.

What is a marketing analytics platform?

A marketing analytics platform is software that connects your marketing data sources, aggregates the data, and presents it for reporting and analysis. Advanced platforms also generate written analysis of what changed in performance and why, beyond just displaying charts.

What is the difference between a marketing analytics platform and a dashboard?

A dashboard displays data visually; you interpret and write the analysis yourself. A marketing analytics platform automates the data pull, report format, and ideally the written performance narrative, reducing the manual reporting workload significantly.

What integrations should a marketing analytics platform have?

At minimum: GA4, Google Ads, Facebook Ads, LinkedIn Ads, and Google Search Console. If your clients use email platforms, CRMs, or e-commerce tools, confirm those integrations as well.

Which marketing analytics platform is best for agencies?

The best marketing analytics platform for agencies has multi-client architecture, white-label reporting, scheduled delivery, and automated written analysis. Evaluate tools on those four criteria specifically, not just on the number of integrations or visual design of dashboards.

How long does it take to set up a marketing analytics platform?

The fastest tools connect channels via OAuth and generate a first report in under an hour. More complex tools with custom dashboard builders can take days or weeks. For agency use, prioritize time-to-first-report as an evaluation criterion.

Is a marketing analytics platform worth it for small agencies?

Yes, if you report to more than three or four clients regularly. The time saved on manual data export, formatting, and writing commentary typically pays for the platform within the first month. The secondary benefit, consistent, branded reports, also supports client retention.

Categories
Reporting

Paid Media Performance Report: The Cross-Platform Structure That Works

A paid media performance report that lumps Google Ads and Meta together into one summary table is technically a cross-platform report and practically useless for optimization. Google and Meta operate on different attribution models, different bidding mechanics, and different buyer intent signals. Combining them without accounting for those differences produces numbers that look comparable but aren’t.

This guide covers how to structure a paid media performance report that is genuinely useful, for both optimization decisions and client communication.

What Should a Paid Media Performance Report Include?

A paid media performance report should include three layers: platform-specific performance, cross-platform summary, and written analysis. In that order of detail, but in reverse order of presentation, clients see the summary first, drill into channel detail if they want it.

Layer 1 – Executive summary:

  • Total spend across all paid channels
  • Total results (leads or purchases, matching business objective)
  • Blended cost per result
  • Blended ROAS (if e-commerce)
  • Period-over-period trend for each

Layer 2 – Channel breakdown (one section per channel):

Google Ads section:

  • Spend, impressions, clicks, CTR, avg CPC
  • Conversions, cost per conversion, conversion rate
  • Campaign performance table (ranked by conversion volume)
  • Search term insights: top queries driving conversions

Meta / Facebook Ads section:

  • Spend, reach, impressions, frequency
  • Results, cost per result, ROAS
  • Campaign and ad set performance table
  • Creative performance: top 3 by conversion rate

Layer 3 – Written analysis: The explanation of what drove the cross-channel performance. Which platform outperformed, why, and what changed versus last period. This is the section that requires the most time to produce manually, and the section clients reference most when making budget decisions.

How Do You Compare Google Ads and Meta Performance in One Report?

Comparing Google Ads and Meta in a single paid media performance report requires acknowledging that their conversion counts are not directly comparable due to attribution differences.

FactorGoogle AdsMeta (Facebook/Instagram)
Default attribution windowLast click, 30-day7-day click, 1-day view
Intent signalActive search intentInterrupted browsing (push)
Conversion typeSearch-driven, higher intentAwareness + retargeting
Primary efficiency metricCost per conversionCost per result / ROAS
Demographic dataKeyword/audienceAge, interest, company (LinkedIn alternative)

The practical solution: report each platform’s numbers using its own attribution model (don’t try to normalize them), show a blended cost-per-result in the summary that uses your GA4 data as the source of truth, and note in the written analysis that the platform-level numbers may double-count some conversions.

This transparency builds more trust than a tidy summary that hides the attribution complexity.

What Is the Right Structure for Cross-Platform Paid Reporting?

Structure a cross-platform paid media performance report in this order:

  1. Headline KPIs – spend, leads/purchases, blended CPL/CPA, blended ROAS (GA4-attributed, not platform-reported)
  2. Platform comparison table – one row per channel: spend, results, CPR, and share of total spend
  3. Google Ads deep-dive – campaign table, top search terms, quality score trend
  4. Meta deep-dive – campaign table, creative performance, frequency analysis
  5. Written analysis – cross-platform narrative: what drove performance, budget allocation observation, recommendation
  6. Next period recommendation – one or two concrete budget or creative actions

The platform comparison table in step 2 is often where the most actionable insight lives. If Google is generating leads at $28 CPL and Meta at $67 CPL, the recommendation is obvious, but only if both numbers appear in the same table with the same metric definition.

How Do You Handle Attribution in a Paid Media Report?

Attribution in a paid media performance report requires choosing one attribution source as the authority and being explicit about it. Three approaches:

Platform-last (each platform self-reports): Simplest, but double-counts shared conversions. Good for internal optimization; not ideal for total budget decisions.

GA4-attributed (source of truth is analytics): GA4 shows conversions by channel using its own attribution model (data-driven by default). This tends to undercount Facebook conversions (iOS privacy limits tracking) and is most accurate for Google Ads.

CRM-attributed (for B2B): Revenue and pipeline are measured at the CRM level, matched back to paid channel via UTM parameters. Most accurate for B2B agencies reporting on lead quality, not just lead volume.

State clearly in your report which attribution method you are using and hold it constant across reporting periods. Attribution model changes between periods make period-over-period comparison meaningless.

How Do Agencies Automate Paid Media Performance Reporting?

Agencies automate paid media performance reporting by connecting Google Ads and Facebook Ads accounts to a unified reporting platform, selecting a cross-channel paid media template, and scheduling delivery. DataMyth connects both channels and generates the written analysis automatically, including the cross-platform narrative, so the monthly paid media report requires review rather than production. See the Paid Media Performance Report page for the full template.

For agencies managing paid media across both Google and Meta for multiple clients, the manual version of this report can take 3–5 hours per client per month. Automation recovers that time entirely and produces a more consistent report every cycle. Explore DataMyth for Marketing Agencies.

What is a paid media performance report?

A paid media performance report is a structured summary of advertising results across paid channels, typically Google Ads and Meta, showing spend, results, efficiency metrics, and a written analysis of what drove performance. It covers both channel-specific detail and a cross-platform summary.

How do you compare Google Ads and Facebook Ads in one report?

Report each platform using its own attribution model, then use GA4 as the cross-platform source of truth for the headline summary. Note the attribution difference in the report so clients understand why platform totals may not add up to the GA4 number.

What metrics belong in a paid media performance report?

Headline metrics: total spend, total results (conversions or purchases), blended cost per result, and ROAS. Channel-level: each platform’s spend, results, CPR, CTR, CPC, and campaign table. Plus a written analysis of what drove the variance.

How often should a paid media performance report be produced?

Monthly for most accounts. Weekly during active campaign launches or A/B testing phases. The report cadence should match how frequently budget decisions are made.

What attribution model should I use in a paid media report?

Choose one model and hold it constant. GA4’s data-driven attribution is a reasonable cross-platform source of truth. Note explicitly which model is in use so clients understand the numbers and so period-over-period comparisons remain valid.

Can paid media reports be automated across both Google and Meta?

Yes. Connect both accounts to a reporting platform like DataMyth, select a cross-channel paid media template, and schedule monthly delivery. The report generates automatically with data from both platforms and a written performance analysis.

Categories
Marketing

Digital Marketing KPIs: The Agency Client Reporting Framework

Choosing the wrong digital marketing KPIs for a client report is not a minor formatting issue, it’s a trust problem. When a PPC agency reports impressions to a client who needed leads, or an SEO agency highlights keyword rankings to a client who needed revenue, the report technically shows real data while completely failing to demonstrate value.

This framework maps the right KPIs to the right clients by channel, objective, and business type, so every report you send measures what the client actually hired you to deliver.

What Are Digital Marketing KPIs and Why Do They Vary by Client?

Digital marketing KPIs are the specific, measurable indicators that show whether a marketing activity is achieving its business goal. They vary by client because different clients have fundamentally different objectives. A B2B SaaS company measures qualified leads and pipeline contribution. An e-commerce brand measures ROAS and revenue. A local service business measures calls, form fills, and cost per acquisition.

Reporting the same metrics to all three clients treats their businesses as interchangeable. The framework below sets KPIs by channel and overlays business objective filters.

Which Digital Marketing KPIs Matter by Channel?

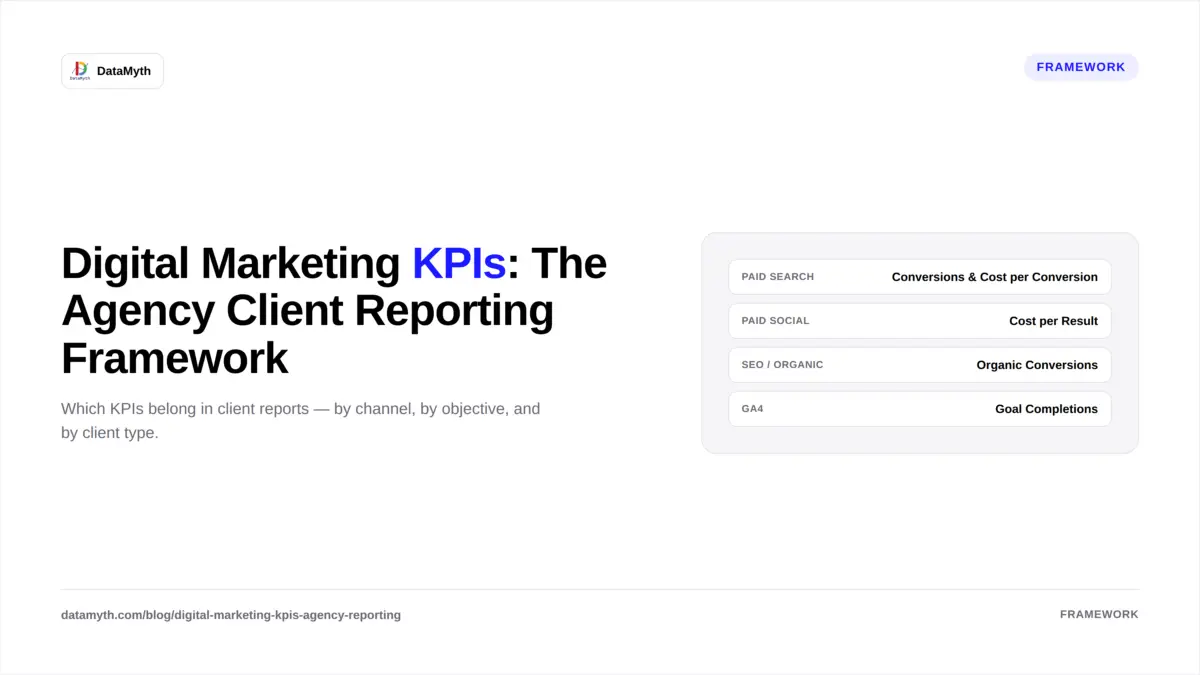
Paid Search (Google Ads)

Primary KPIs:

  • Conversions (leads, purchases, or calls, match to objective)
  • Cost per Conversion
  • Conversion Rate
  • ROAS (e-commerce only)

Context KPIs (supporting, not headline):

  • Impression Share
  • Average CPC
  • Quality Score trends
  • Search Term match efficiency

Omit from client-facing reports: Average position (deprecated), click volume without conversion context.

Paid Social (Facebook / Meta, LinkedIn)

Primary KPIs:

  • Results (leads, purchases, whatever the campaign objective is)
  • Cost per Result
  • ROAS (e-commerce)
  • Lead Form Completion Rate (LinkedIn / Meta lead campaigns)

Context KPIs:

  • Frequency (creative fatigue signal)
  • Link CTR
  • Demographic breakdown (LinkedIn-specific)

Omit: Reactions, shares, 3-second video views, reach as a success metric.

SEO / Organic Search

Primary KPIs:

  • Organic Sessions
  • Organic Conversions (or assisted conversions)
  • Revenue from Organic (if tracked)
  • Keyword Ranking Movement (for target terms)

Context KPIs:

  • Click-Through Rate from Search Console
  • Impressions trend (Search Console)
  • Backlinks acquired

Omit: Domain authority as a client-facing performance metric (it’s a diagnostic, not an outcome).

Email Marketing

Primary KPIs:

  • Revenue per Email (e-commerce)
  • Conversion Rate
  • List Growth Rate

Context KPIs:

  • Open Rate (directional, not a success metric)
  • Click-to-Open Rate
  • Unsubscribe Rate

Omit: Raw open rates as headline metric, iOS privacy changes have degraded their accuracy.

Google Analytics / GA4 (Cross-Channel)

Primary KPIs:

  • Goal Completions / Key Events
  • Engagement Rate
  • New vs. Returning Users (by channel)
  • Revenue (if GA4 e-commerce is configured)

Context KPIs:

  • Sessions by Channel
  • Average Engagement Time
  • Landing Page performance

How Should Agencies Set KPIs at the Start of a Client Engagement?

Set digital marketing KPIs at the start of every client engagement using a three-question process:

Question 1: What is the client’s business goal? Leads, revenue, brand awareness, retention, the business goal defines the category of KPI.

Question 2: What does success look like numerically? A 20% increase in qualified leads, a CPL under $80, a ROAS above 3.5x. Without a target, a KPI is just a metric.

Question 3: What data can we reliably track? If conversion tracking is not set up, reporting on conversions is misleading. Confirm tracking integrity before setting KPIs you cannot measure.

Document the agreed KPIs in a shared brief and include them in the first section of every monthly report, so the client always sees current performance measured against the goal they signed off on.

What Is the Difference Between a KPI and a Metric?

A metric is any measurable number, impressions, clicks, sessions, opens. A KPI is a metric that has been selected because it is directly tied to a business goal and has a target. Every KPI is a metric, but most metrics are not KPIs.

This distinction matters for reporting. A report that lists every available metric from every platform is not a performance report, it’s a data dump. A report that shows five agreed KPIs versus their targets, with a written analysis of what drove the variance, is a performance report. The latter earns client trust. The former loses it.

How Do You Build a KPI Dashboard for Reporting?

Build a digital marketing KPI dashboard by:

(1) pulling data from your connected channels automatically,

(2) surfacing only the agreed client KPIs in the headline row,

(3) including period-over-period variance for every KPI, and

(4) adding a written performance narrative.

DataMyth automates steps 1, 2, 3, and 4, connecting GA4, Google Ads, Facebook Ads, LinkedIn Ads, and Search Console in a single report that writes the performance analysis automatically. Visit the DataMyth features page or explore the Google Analytics Report and Google Ads Report tools.

What are digital marketing KPIs?

Digital marketing KPIs are specific, measurable indicators tied to a business goal, such as cost per lead, ROAS, or organic conversions. They differ from generic metrics because they have agreed targets and directly reflect whether marketing is achieving the client’s objective.

How many KPIs should a marketing report include?

Most client reports work best with three to five headline KPIs, enough to cover the primary goal without overwhelming non-marketing stakeholders. Support each headline KPI with two or three context metrics, not the full platform data export.

What are the most important digital marketing KPIs for e-commerce?

For e-commerce, the core KPIs are ROAS, cost per purchase, revenue from paid channels, organic revenue, and conversion rate by channel. These directly link marketing spend to revenue outcomes.

What are digital marketing KPIs for B2B?

For B2B, the primary KPIs are qualified leads, cost per lead, lead-to-opportunity rate (if CRM is connected), and pipeline influenced. Supporting KPIs include campaign CTR, cost per click, and demographic quality data (especially for LinkedIn Ads).

How do you choose KPIs for a new marketing client?

Match KPIs to the client’s stated business goal, set a numeric target for each, and confirm that conversion tracking is in place to measure them accurately. Agree on the KPI set in writing before the first report is sent.

How do digital marketing KPIs differ from vanity metrics?

A KPI is tied to a business outcome and has a target. A vanity metric, like impressions, follower count, or raw page views, can increase while business results decline. The test: if the metric went up while revenue, leads, or conversions went down, it is a vanity metric.

Categories
Reporting

Can I Schedule Automated Client Reports? Yes, Here’s How

Yes, you can schedule automated client reports. Modern marketing reporting platforms let you connect your client’s channels once, configure a report template, set a delivery schedule, and have the report generate and send automatically, without touching it manually each period. Here is exactly how to do it and what to think through before you set it up.

What Does It Mean to Schedule Automated Client Reports?

Scheduling automated client reports means configuring a reporting system to generate and deliver formatted performance reports at a set interval, weekly, monthly, or quarterly, without requiring manual data export, template updates, or written commentary each time. The system pulls live data from connected channels, applies the report layout, generates any written analysis, and delivers the report (as a link or PDF) to the recipient automatically.

The result: on the first Monday of every month, your client’s report arrives in their inbox without your team spending three hours assembling it.

How Do You Set Up Scheduled Client Report Delivery?

Setting up scheduled automated client reports involves five steps:

Step 1 — Connect data sources. Link your client’s channels, GA4, Google Ads, Facebook Ads, LinkedIn Ads, Google Search Console, to your reporting platform using secure OAuth authentication. This is a one-time setup per client account. No manual exports after this point.

Step 2 – Choose or build a report template. Select a template that matches the client’s reporting needs. A Google Ads-focused report looks different from a cross-channel agency report. Most platforms offer pre-built templates by channel; DataMyth provides channel-specific templates with automated analysis built in.

Step 3 – Configure the reporting period. Set the default date range, last 30 days, last month (calendar), or a custom range. Decide whether it compares to the prior period automatically.

Step 4 – Set the schedule. Choose the delivery frequency: weekly (typically for active testing phases), monthly (default for most client accounts), or quarterly (for strategic review reports). Set the exact delivery day and time. Monday morning delivery works well, clients often review performance at the start of the week.

Step 5 – Set recipients and delivery format. Add the client contact email and any internal stakeholders. Choose between a live link (always shows current data) or a PDF snapshot (fixed at generation time). For most client-facing reports, a PDF snapshot is cleaner, it represents the period as it was when you sent it.

What Should You Automate First in Your Client Reporting Workflow?

Prioritize automating the parts of reporting that consume the most time with the least strategic value:

Reporting taskAutomate?Why
Data export from each platformYes — immediatelyPure mechanical work, no judgment required
Report formatting and layoutYesTemplate-driven, consistent across clients
Period-over-period calculationsYesArithmetic, not analysis
Written performance analysisYes (if tool supports it)Biggest time sink; DataMyth generates this automatically
Strategic recommendationNoRequires account knowledge and judgment
Client communication contextNoRelationship-specific, cannot be templated

The written analysis is the most important item to automate if your tool supports it. Agencies report spending 2–4 hours per client per month writing the “what changed and why” narrative. Automating this, while retaining the strategic recommendation, recovers the majority of reporting time without reducing the value you deliver.

How Often Should Scheduled Client Reports Run?

Monthly is the right default for most client accounts. Monthly cadence gives enough data for meaningful trend analysis, aligns with budget cycles, and gives clients the rhythm they expect. Weekly reports are appropriate during active A/B testing phases or when a client is launching a new campaign and wants frequent visibility. Quarterly reports serve strategy reviews.

The scheduling decision should match how fast the channel moves:

  • Google Ads (active): Weekly during launch, monthly ongoing
  • Facebook Ads (active testing): Weekly or bi-weekly during creative testing, monthly ongoing
  • SEO / organic: Monthly (weekly organic data is mostly noise)
  • LinkedIn Ads: Monthly (B2B sales cycles are too long for meaningful weekly movement)
  • Cross-channel summary: Monthly, with quarterly strategic review

One practical note: schedule the report to generate 24–48 hours before delivery to allow time for a human review. A scheduled report that goes directly to the client without review creates accountability gaps. The scheduling system handles the generation; your team handles the final read and send.

Can You Schedule Automated Client Reports for Multiple Clients at Once?

Yes. A reporting platform built for agencies, like DataMyth, lets you manage multiple client accounts in a single interface, each with its own template, schedule, and recipient list. Adding a new client’s account does not require rebuilding your reporting infrastructure; you connect the channels, apply the template, and configure the schedule in minutes.

This is the scalability argument for automation: the 30th client account costs nearly the same reporting effort as the first, because the system handles the repetitive steps for all of them simultaneously. See how DataMyth handles agency reporting at scale.

Categories
Reporting

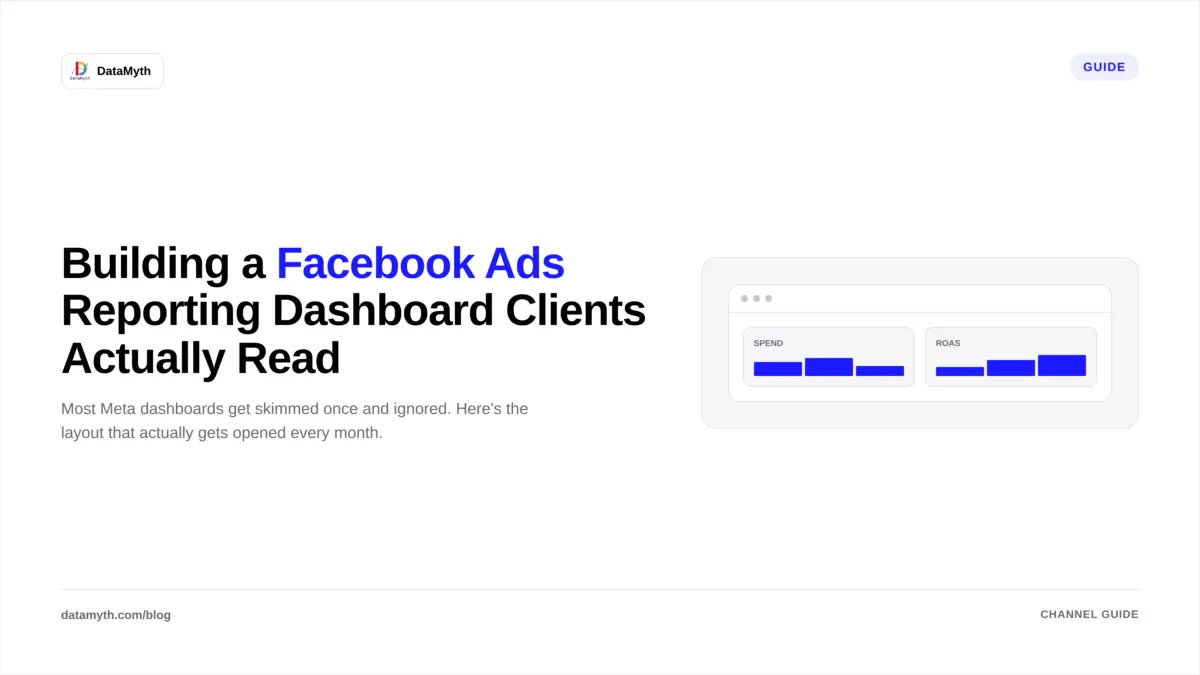
Facebook Ads Reporting Dashboard: What Actually Works (And What’s Just Vanity)

A well-built Facebook Ads reporting dashboard tells you whether your budget is generating results. A poorly built one tells you how many times people saw your ad, information that is technically accurate and strategically meaningless when a client asks why conversions dropped last month.

The difference comes down to metric selection, layout, and whether the dashboard includes written analysis or just numbers. This guide covers all three.

What Should a Facebook Ads Reporting Dashboard Include?

A Facebook Ads reporting dashboard should lead with outcome metrics, results, cost per result, and ROAS, before any exposure or engagement data. The structure that works:

Tier 1 – Business outcomes (headline row):

  • Results (conversions, leads, or purchases, whatever the campaign objective is)
  • Cost per result
  • ROAS (for e-commerce campaigns)
  • Total spend vs. budget

Tier 2 – Efficiency signals (context row):

  • Impressions and reach
  • Frequency
  • CTR (link click-through rate)
  • CPC (cost per link click)

Tier 3 – Diagnosis (campaign-level table):

  • Campaigns ranked by cost per result
  • Ad sets and ads with highest/lowest performance
  • Creative performance: top 3 and bottom 3 by CTR and conversion rate

Tier 4 – Written analysis: This is the tier most dashboards skip entirely. The written analysis explains what drove the numbers, which campaign, ad set, or creative caused a shift in results or cost, and is the section clients actually read. Without it, you have a Facebook reporting dashboard. With it, you have a Facebook performance report that earns the account renewal.

Dashboard ElementInclude?Why
Reach & ImpressionsContext onlyAwareness signal, not success metric
FrequencyYes – monitored carefullyAbove 3–4 = creative fatigue, rising CPCs
CTR (all)No – use Link CTR instead“All” CTR includes reactions, comments; misleading
Link CTRYesTrue click-through to destination
CPCYesEfficiency context
Cost per ResultYes – headlinePrimary efficiency metric
ROASYes (e-commerce)Revenue return on spend
3-second video viewsNoVanity; nearly meaningless for business outcomes
Video view-through rateContext onlyCreative quality indicator
Relevance score (Quality)MonitorLow score = ad fatigue or audience mismatch

Which Facebook Ads Metrics Are Vanity Metrics to Avoid?

Vanity metrics in Facebook Ads reporting are metrics that can increase while results decline. The most common examples: Impressions can climb if you raise your budget without improving targeting, yet cost per result worsens. Reach says nothing about whether the right people were reached. Post reactions and shares feel positive but rarely correlate with business outcomes. 3-second video views are counted when a user scrolls past without pausing intentionally.

The test for any metric: if it improved while results got worse, it’s providing a false signal. Strip those from the headline row of your dashboard and move them to a monitoring tier at most.

How Do You Set Up a Facebook Ads Reporting Dashboard?

To set up a Facebook Ads reporting dashboard that actually serves your reporting needs:

Step 1 – Define the campaign objective first. A lead generation campaign measures cost per lead. A purchase campaign measures cost per purchase and ROAS. An awareness campaign measures reach and frequency. The objective determines which Tier 1 metrics appear. One dashboard template does not fit all campaign types.

Step 2 – Connect to a reporting tool. Meta Business Suite’s native reporting is functional but not agency-ready. It lacks scheduling, white-labeling, and cross-account comparisons. Connect to a dedicated reporting platform that pulls Facebook Ads data automatically.

Step 3 – Set the comparison period. Every metric should show period-over-period change. A cost per result of $12.50 means nothing alone; $12.50 vs. $9.80 last month is a 28% efficiency decline that requires explanation.

Step 4 – Add the written analysis layer. Manually, this means reviewing the campaign table, identifying the driver of any change, and writing a short narrative. Automated tools like DataMyth generate this analysis automatically, identifying which campaign or ad set caused the shift and ranking the causes by degree of impact. See the Facebook Ads Report page for how this works in practice.

Step 5 – Schedule delivery. Set the report to generate and deliver monthly (weekly for active testing phases). The client should receive it without you manually triggering anything.

How Often Should a Facebook Ads Dashboard Be Updated?

Update your Facebook Ads reporting dashboard live (daily or real-time) for internal monitoring, and send the formal report monthly for stakeholder communication. The distinction matters: a live dashboard helps your team catch creative fatigue or budget pacing issues in real time. The monthly report is the strategic communication to the client, it requires written analysis and a recommendation, not just refreshed numbers.

For agencies running heavy A/B testing, a weekly report cadence makes sense during active test periods, dropping back to monthly once creative strategy is settled.

How Do Agencies Automate Facebook Ads Reporting?

Agencies automate Facebook Ads reporting by connecting their ad accounts once to a reporting platform, configuring a template that matches their reporting structure, and scheduling the report to generate automatically.

The platforms that do this well handle three things: automatic data pull from Meta, consistent report formatting, and written analysis of performance changes. The third is the differentiator, most tools automate the pull and formatting but leave the analysis to the account manager. DataMyth automates all three, including the narrative explaining what changed and why. Explore the DataMyth features or the Facebook Ads report template.