
A marketing report template that is built correctly is one of the highest-leverage investments an agency or in-house team can make. Build it once, maintain it quarterly, and use it for every client, every month. Fail to build it thoughtfully and every reporting cycle involves rebuilding structure from scratch, reformatting data to fit a layout that does not quite work, and sending something that looks slightly different from last month’s version.
This guide covers exactly what a marketing report template needs to include, how to structure the channel data sections, and when a custom-built template should be replaced with an automated reporting platform.
What Is a Marketing Report Template?
A marketing report template is a pre-structured document that defines the layout, sections, visual hierarchy, and data organisation for every marketing performance report. It is the scaffold that holds the changing data each month without requiring the account manager to rebuild the document structure from scratch.
The template is not the report, it is the repeatable container into which the month’s data and analysis are placed. A good template makes producing a high-quality report faster without making all reports look generic.
What Sections Must Every Marketing Report Template Include?
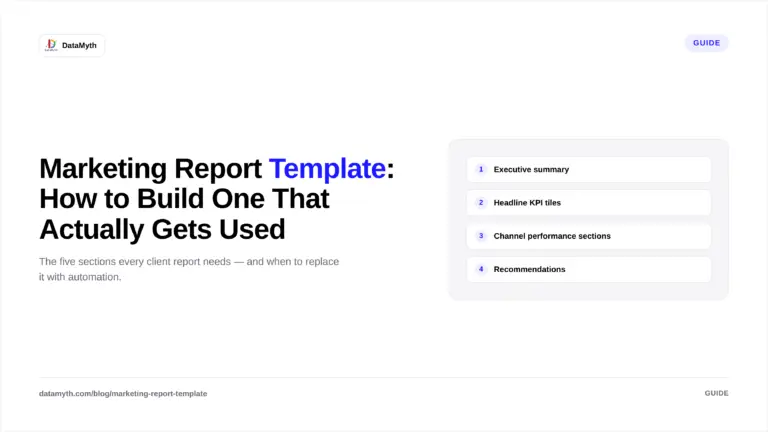
A complete marketing report template for a client-facing marketing report contains these sections, in order:
Section 1: Executive Summary
One page maximum. Contains: the verdict on the period (strong, mixed, or difficult, with specific reasons), the two or three most important findings, and the top recommendation for the next period. This section is written fresh every month; the template defines the structure, not the content.
Section 2: Headline KPI Tiles
Four to six large-format KPI indicators showing the most important metrics at a glance. Each tile should show: the metric name, the current period value, the prior period value, and the percentage change. Use green/red or up/down arrows for direction, not colour alone (colour-blind accessibility).
For an ecommerce client, the headline KPI tiles might be: Total Revenue, ROAS, Cost per Purchase, Sessions from Paid, Organic Sessions, and Conversion Rate.
For a B2B SaaS client: MQLs, Cost per MQL, Demo Requests, Trial Sign-ups, Organic Branded Search Clicks, and Customer Acquisition Cost.
Section 3: Channel Performance Sections
One section per active channel. Standard structure for each channel section:
| Sub-element | Content |
|---|---|
| Channel headline metric | The single most important metric for this channel, large |
| Supporting metrics table | 5-8 metrics with current period, prior period, and change |
| Performance trend chart | Line chart showing the headline metric over 6-12 months |
| Written analysis | 2-3 paragraphs: what changed, why it changed, what the trend means |
Channel sections typically include: Paid Search, Paid Social, Organic Search, Email (if applicable), and Direct/Other. Each section uses the same structure so the client can navigate to any channel and immediately find the information in the same place.
Section 4: Recommendations
Three to five specific, actionable recommendations for the next period. Format:
Recommendation: What should be done Rationale: Why — supported by specific data from this report Expected outcome: What result it should produce Owner: Agency, client, or shared
Section 5: Data Appendix (Optional)
Full channel data tables for clients who want access to detailed numbers beyond the summary view. This section is optional and should be clearly labelled as supplementary data, not part of the primary report narrative.
How Do You Structure Channel Data in a Marketing Report Template?
Marketing report template channel data structure follows a hierarchy principle: summarise first, detail second.
For each channel, the template shows the most important metric at the top (largest visual element), followed by a table of supporting metrics, followed by a chart of the trend, followed by the written analysis. This structure means the account manager fills in the same positions every month, and the client reads in the same direction every month.
Data table format for each channel:
| Metric | This month | Last month | Change (%) | YoY change (%) |
|---|---|---|---|---|
| Primary metric | [value] | [value] | [%] | [%] |
| Secondary metric 1 | [value] | [value] | [%] | [%] |
| Secondary metric 2 | [value] | [value] | [%] | [%] |
Always include both month-over-month and year-over-year comparisons. For clients in seasonal industries, YoY context is often more meaningful than MoM, a 30% traffic drop in January following a retail peak in December is not an alarming signal unless it is 30% worse than January of the prior year.
What Design Principles Apply to a Marketing Report Template?
A marketing report template that is well-designed requires less reading effort from the client, which directly increases how thoroughly the report is read and how much of the agency’s analysis is absorbed.
Four design principles:
Consistent visual hierarchy. The most important element on each page is visually largest. Section headers are consistent in size and style. Chart titles are consistent in weight and position.
Minimal colour use. Two to three colours maximum: your brand primary, your brand secondary, and a neutral. Use colour for emphasis (KPI tiles, chart lines) and white/neutral for backgrounds and text.
Charts matched to data type. Line charts for trends, bar charts for comparisons, single numbers for headline KPIs. Never use pie charts for marketing data — the mental calculation required to compare segments is harder than reading a bar chart.
White space is not empty space. Padding around metrics, spacing between sections, and margins on page edges all make the report easier to read. A dense report filled edge to edge is harder to process than a spacious one, even when the content is identical.
When Should You Replace a Custom Template With an Automated Reporting Tool?
A custom marketing report template is appropriate when: you have a single client with specific requirements, you have a dedicated designer, or the reporting volume is low enough that manual production is not a significant time burden.
Replace it with an automated reporting tool when: you have more than three clients receiving regular reports, manual production is taking more than 2-3 hours per client per month, or data errors in manually assembled reports are causing client trust issues.
DataMyth provides a structured template framework that connects directly to your client’s channels (GA4, Google Ads, Facebook Ads, LinkedIn, Search Console) and populates each section automatically — KPI tiles, channel performance tables, trend charts, and written analysis — without manual data extraction or formatting. Start with DataMyth’s report template.
The time to switch is earlier than most agencies think. The cost of a manual reporting workflow — in time, in errors, and in inconsistency — accumulates quickly across even a small client roster.
How Often Should a Marketing Report Template Be Updated?
A marketing report template should be reviewed quarterly and updated when:
- A new channel is added to the client’s marketing mix
- A significant GA4 or platform update changes available metrics
- The client’s primary business goals change (which changes the headline KPI tiles)
- Feedback from clients indicates a section is unclear or underused
Annual major reviews are appropriate for established templates. The goal is a living document that evolves with the client’s business, not a static structure that becomes misaligned over time.