
A GA4 custom report is the difference between pulling the data GA4 shows you by default and pulling the data your client actually needs to make decisions. Default GA4 reports are designed for broad utility, they cover common use cases for many types of users. Custom reports are designed for a specific client’s specific questions: which channels drive their highest-converting sessions, which pages are entry points for their paid traffic, which devices show conversion rate anomalies.
This guide covers the GA4 custom report building process from the Explore interface through to the filter and dimension combinations that produce the most useful client reporting data.
What Is a GA4 Custom Report and Why Do Agencies Need It?
A GA4 custom report (built using GA4’s Explore tool) is a report layout that you define — choosing the specific dimensions, metrics, and filters that answer a specific question, rather than using GA4’s standard pre-built reports.
Standard GA4 reports are useful for quick checks but limited for client reporting because:
- They cannot be saved and reused in the same configuration across sessions
- They do not support all dimension and metric combinations
- They cannot be directly shared with clients through a persistent link
- They display GA4’s default metric selection, not the specific metrics relevant to each client’s goals
Custom reports (explorations) solve all four problems: they are saved, configurable, shareable, and entirely controlled by the analyst.
What Types of GA4 Custom Reports Should Agencies Build?
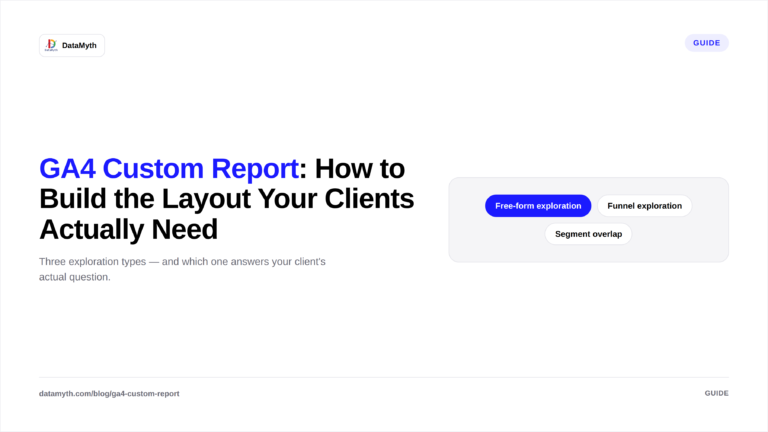
Three GA4 custom report types cover the vast majority of agency client reporting needs:
Free-form exploration (most flexible)
The free-form exploration allows you to configure a table or chart with any combination of dimensions and metrics available in GA4. This is the right format for: channel-level acquisition analysis, landing page performance analysis, conversion path analysis, and device-specific performance breakdowns.
Funnel exploration
The funnel exploration maps user progress through a defined sequence of steps, for example, from the paid ad landing page through to the checkout confirmation page. This is the right format for: ecommerce checkout funnel analysis, lead generation form completion analysis, and content engagement funnel analysis.
Segment overlap
The segment overlap exploration shows the intersection of two or three audience segments. This is the right format for: understanding which channel’s audience also converts on email, which device segment shows the highest purchase rate, and which geographic segment has the strongest engagement with specific content.
How Do You Build a GA4 Free-Form Custom Report for Client Reporting?
The step-by-step process for building a GA4 custom report using the free-form exploration:
Step 1: Open Explore In GA4, navigate to Explore from the left sidebar. Click the blank exploration template or use the template gallery for a starting point.
Step 2: Set the date range Set the reporting period (typically the current month and the prior month for comparison) in the top left of the Explore panel. Always verify this date range before adding any data — the most common GA4 custom report error is generating the correct report for the wrong date range.
Step 3: Add dimensions to the Rows section Drag the dimensions you need from the Variables panel to the Rows section. For a channel performance report: Session default channel group. For a landing page report: Landing page + query string. For a campaign report: Session campaign, Session source/medium.
Step 4: Add metrics to the Values section Drag the metrics that answer your client’s questions from the Variables panel to the Values section. Core metrics for most client reports:
| Metric | What it shows |
|---|---|
| Sessions | Volume of visits |
| Engaged sessions | Quality visits (10+ sec, 2+ pages, or conversion) |
| Engagement rate | % of sessions that were engaged |
| Conversions | Goal completions (confirm which events are marked as conversions) |
| Conversion rate | Conversions as % of sessions |
| Revenue (ecommerce only) | Direct revenue attribution |
Step 5: Add filters for relevance If the report should show only paid traffic, add a filter for Session medium = cpc. If it should show only a specific country or device type, filter accordingly. Filters in GA4 custom reports are applied to all data in the exploration, they are powerful but easy to forget, which causes the most confusing data discrepancies.
Step 6: Save the exploration Explorations are automatically saved to your GA4 account and accessible from the Explore hub. Name each exploration clearly: “[Client Name], [Report Type], [Date Created].”
What Dimensions and Metrics Work Best for Client Reporting?
GA4 custom report dimension and metric combinations for specific client reporting use cases:
| Report type | Key dimensions | Key metrics |
|---|---|---|
| Channel acquisition | Session default channel group | Sessions, Engaged sessions, Conversions, Conv. rate |
| Landing page performance | Landing page + query string | Sessions, Bounce rate, Engagement rate, Conversions |
| Campaign performance | Session campaign, Session source | Sessions, Conversions, Cost (if imported), ROAS |
| Geographic performance | Country, Region | Sessions, Conversions, Revenue |
| Device performance | Device category | Sessions, Engagement rate, Conversions, Conv. rate |
| Content engagement | Page title, Page path | Views, Avg. engagement time, Scroll depth |
How Do You Share a GA4 Custom Report With Clients?
GA4 custom reports (explorations) can be shared with other users who have access to the same GA4 property in two ways:
Share within GA4: Open the exploration and use the share icon to share the exploration URL with another GA4 user on the property. They access it with their own GA4 login.
Export to Looker Studio: Link the GA4 property to Looker Studio (formerly Data Studio) and recreate the custom report as a Looker Studio report. This can then be shared as a view-only link that the client can access without a GA4 account.
For most agency-client reporting workflows, the best approach is to use GA4 custom explorations as the data source for internal analysis and build the client-facing report from the exported data in a formatted report document or an automated reporting tool.
DataMyth connects to GA4 directly and pulls the relevant data automatically, applying the same dimension and metric configuration every cycle. This means the GA4 custom report configuration is a one-time setup rather than a monthly manual rebuild. Connect GA4 to DataMyth.
What Are the Most Common GA4 Custom Report Mistakes for Agencies?
Wrong date range. The most common error. Check the date range before exporting any data. A report with the correct metrics but the wrong date range is factually incorrect.
Confusing sessions with users. Sessions count visits (one user can generate multiple sessions). Users count unique individuals. Depending on the question, one may be more relevant than the other. Establish which metric the client’s report uses as the primary traffic indicator and apply it consistently.
Not verifying conversion event setup. GA4 custom reports show conversions only for events that are marked as Conversions in Admin > Events. If the form submission event is not marked, it will not appear in conversion metrics in any report. Always verify conversion event configuration before the first report.
Forgetting applied filters. If you set a filter for device = mobile in a previous session and do not remove it before saving a new exploration, every report built in that session will show mobile-only data. Review applied filters before saving any exploration.