Every marketing team needs a marketing analytics platform, a place where data from every channel is gathered, organized, and made useful. The problem is that “marketing analytics platform” now describes three very different categories of software: data visualization tools, reporting automation tools, and AI-driven insight platforms. Choosing between them requires being clear about what problem you actually have.
This guide defines the categories, sets out seven evaluation criteria, and gives agencies and in-house teams a framework for picking a platform that fits what they need now, not what looks impressive in a demo.
What Is a Marketing Analytics Platform?
A marketing analytics platform is software that connects your marketing data sources, aggregates the data in one place, and presents it in a structured format for analysis and reporting. Beyond that definition, platforms diverge significantly:
- Data visualization tools (Looker Studio, Tableau): powerful for building custom dashboards but require manual analysis. They show you what happened; they do not explain why.
- Reporting automation platforms (DashThis, AgencyAnalytics): automate data pulling and report formatting. They remove the manual export step but still leave the written analysis to you.
- AI-driven insight platforms (DataMyth): automate the data pull, the formatting, and the written performance analysis, identifying what changed, why, and ranking causes by degree of impact.
Most buyers start by comparing price and integrations. The more useful comparison is: where in the reporting workflow does this tool stop helping you?
What Are the Key Criteria for Choosing a Marketing Analytics Platform?
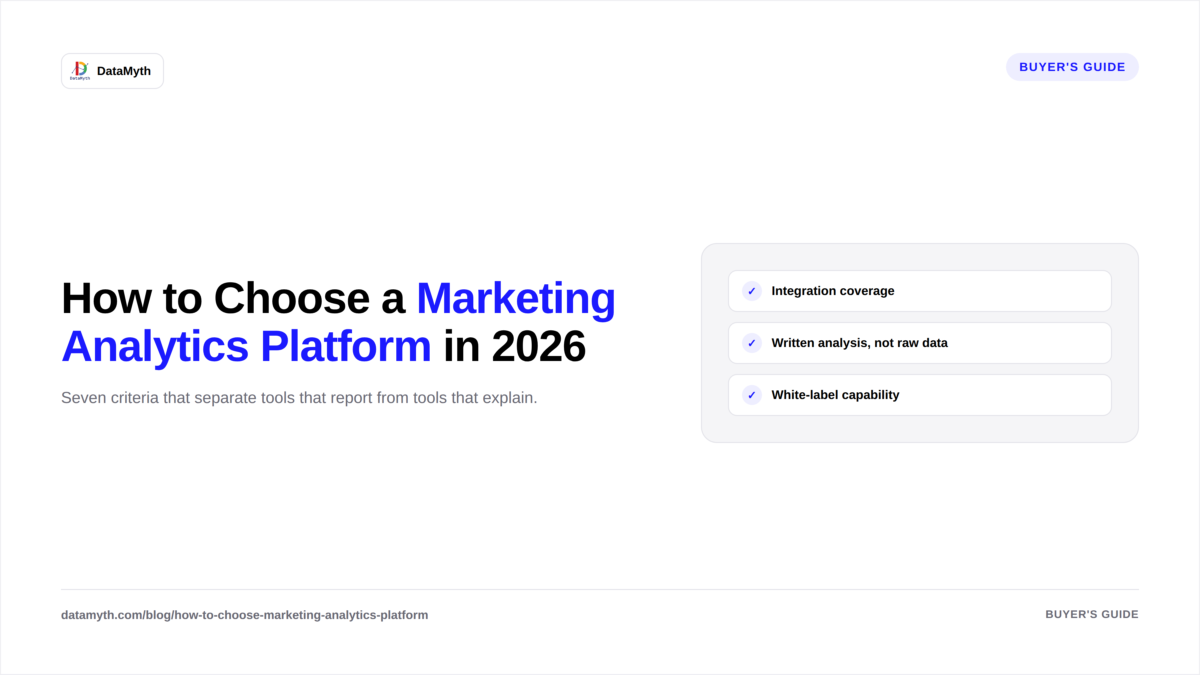
Evaluate a marketing analytics platform against these seven criteria before committing:
1. Integration coverage. Does it connect to the channels you actually use? Core integrations to require: GA4, Google Ads, Facebook Ads, LinkedIn Ads, Google Search Console. If you use HubSpot, Shopify, or email platforms, confirm those connections too. An analytics platform is only as useful as the data it can access.
2. Written analysis vs. raw data. Does the platform interpret the data or just display it? Tools that produce charts and tables require you to write the analysis. Tools that generate written performance narratives, explaining what changed and why, recover hours of agency time per client per month. This is the most consequential difference between categories and the one most often overlooked in demos.
3. White-label capability. For agencies, white-labeling is non-negotiable. Every client-facing report should carry the agency’s brand. Confirm whether white-labeling is included in the base plan or gated behind higher tiers.
4. Scheduling and automation. Can the platform generate and deliver reports automatically on a set cadence? Manually triggering reports every month defeats the purpose of a reporting tool. Scheduling should be configurable by client, with different cadences for different accounts.
5. Multi-account management. Agencies managing 20+ clients need a platform designed for account-level management, not a tool that requires a separate login per client. Confirm that the platform surfaces all accounts in one view and supports bulk operations.
6. Pricing model alignment. Per-client pricing scales badly for agencies. Per-seat pricing is opaque when teams grow. Look for pricing models that align with how you actually work, flat-rate with unlimited reports and accounts is the cleanest for agencies.
7. Time-to-first-report. How long does it take to go from sign-up to first client report? If onboarding takes two weeks and requires developer support, the platform will be underused. The fastest tools connect channels and generate a first report in under an hour.
How Is a Marketing Analytics Platform Different from a Dashboard Tool?
| Dimension | Dashboard tool (e.g., Looker Studio) | Marketing analytics platform (e.g., DataMyth) |
|---|---|---|
| Data connection | Manual or semi-automated | Automated, OAuth-based |
| Report format | Visual charts; you design the layout | Pre-built templates by channel |
| Written analysis | None, you write it | Automated, generated with the report |
| White-label | Limited or requires workarounds | Native, per-client |
| Scheduling | None native | Scheduled delivery by cadence |
| Pricing | Free (Looker Studio) or per-seat | Per account or flat-rate |
| Learning curve | High (requires template-building skill) | Low (connect and generate) |
| Best for | Analysts who want full control | Agencies and teams who want reporting done |
The clearest signal for which category you need: if you spend more than two hours per client per month writing commentary on your own charts, you need a platform that writes it for you. If you have a dedicated analyst who enjoys building custom views, a visualization tool gives more flexibility.
What Should Agencies Look for That In-House Teams Don’t?
Agencies evaluating a marketing analytics platform have requirements that in-house teams don’t:
- Multi-client architecture: One interface showing all client accounts, each with separate templates, schedules, and branding. Not a per-account login.
- Scalable pricing: Adding the 25th client should not require a call with sales or a pricing negotiation. Confirm upfront.
- White-label everything: Not just the report logo, the report URL, the PDF export filename, and any client-facing interface.
- Consistent output across accounts: Every client report should look professionally consistent, not like a different team member did each one.
- Written analysis that saves account-manager time: The written narrative is the highest-effort part of reporting. Automating it is what lets an agency scale from 15 to 30 clients without hiring another account manager.
How Much Does a Marketing Analytics Platform Cost?
Marketing analytics platform pricing ranges from free (Looker Studio, which requires full self-service) to $50–$400/month for mid-market tools depending on accounts, users, and features. For agencies:
- Tools that charge per-client: pricing scales with your client count, which is the worst model for growing agencies
- Tools with flat-rate unlimited accounts: predictable cost regardless of how many clients you add
- Enterprise tools: custom pricing, often negotiated annually
DataMyth offers a 7-day free trial with no credit card required. See DataMyth pricing for current plan details.
What is a marketing analytics platform?
A marketing analytics platform is software that connects your marketing data sources, aggregates the data, and presents it for reporting and analysis. Advanced platforms also generate written analysis of what changed in performance and why, beyond just displaying charts.
What is the difference between a marketing analytics platform and a dashboard?
A dashboard displays data visually; you interpret and write the analysis yourself. A marketing analytics platform automates the data pull, report format, and ideally the written performance narrative, reducing the manual reporting workload significantly.
What integrations should a marketing analytics platform have?
At minimum: GA4, Google Ads, Facebook Ads, LinkedIn Ads, and Google Search Console. If your clients use email platforms, CRMs, or e-commerce tools, confirm those integrations as well.
Which marketing analytics platform is best for agencies?
The best marketing analytics platform for agencies has multi-client architecture, white-label reporting, scheduled delivery, and automated written analysis. Evaluate tools on those four criteria specifically, not just on the number of integrations or visual design of dashboards.
How long does it take to set up a marketing analytics platform?
The fastest tools connect channels via OAuth and generate a first report in under an hour. More complex tools with custom dashboard builders can take days or weeks. For agency use, prioritize time-to-first-report as an evaluation criterion.
Is a marketing analytics platform worth it for small agencies?
Yes, if you report to more than three or four clients regularly. The time saved on manual data export, formatting, and writing commentary typically pays for the platform within the first month. The secondary benefit, consistent, branded reports, also supports client retention.