
A Google Ads performance report that is built for an account manager to review internally and a Google Ads performance report built for a client to read are two very different documents. The internal version can show Quality Scores, impression share breakdowns, bid modifier performance, and auction insights. The client-facing version should show whether the investment is producing the business outcomes the client cares about, with enough context to explain why.
Most agencies produce a version somewhere between the two: too much data for an executive but not enough for an analyst. This guide covers how to build a Google Ads performance report that communicates clearly at the client level without hiding the analysis that informs the agency’s work.
What Metrics Belong in a Google Ads Performance Report?
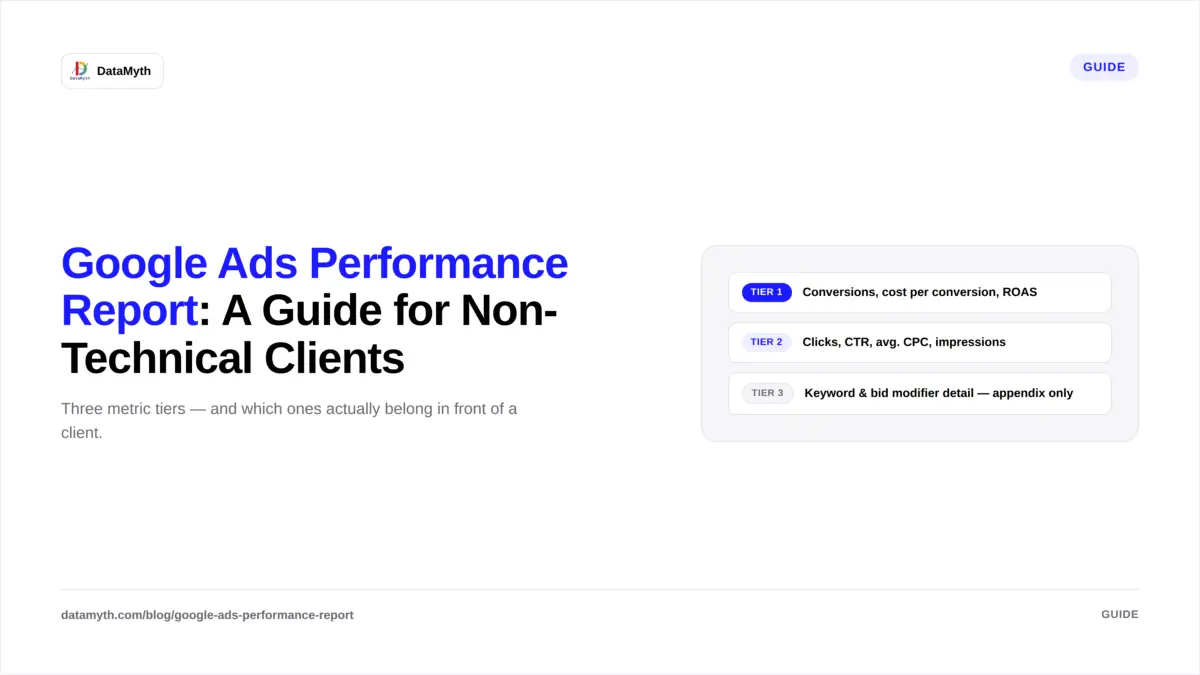
A client-facing Google Ads performance report should include metrics in three tiers: headline business metrics, channel efficiency metrics, and diagnostic metrics.
Tier 1: Headline business metrics (most prominent)
These are the metrics that directly answer “is this investment worthwhile?” They belong in the KPI tile section of the report and carry the highest visual weight.
| Metric | What it answers | Client-facing label |
|---|---|---|
| Conversions | Did the campaign produce the goal event? | Leads generated / Purchases / Bookings |
| Cost per conversion | How much did each result cost? | Cost per lead / Cost per purchase |
| Revenue (ecommerce) | How much revenue did the campaign produce? | Revenue from Google Ads |
| ROAS (ecommerce) | Did the spend return more than it cost? | Return on ad spend |
| Conversion rate | Of all clicks, how many converted? | Click-to-conversion rate |
Tier 2: Channel efficiency metrics (supporting)
These metrics provide context for the headline figures and explain the mechanism. They belong in the channel performance table, visible but not dominant.
| Metric | What it explains |
|---|---|
| Clicks | Volume of traffic produced |
| CTR | How well the ads attract clicks for the queries shown |
| Average CPC | Cost of each click |
| Impressions | How often the ads appeared |
| Average position / Impression share | How visible the campaign is in auction |
| Quality Score | Ad relevance and landing page quality (weekly check, not monthly report) |
Tier 3: Diagnostic metrics (internal or appendix only)
Keyword-level performance, match type breakdowns, device bid modifier analysis, audience modifier performance. These are the metrics the agency uses to make optimisation decisions, not the metrics the client needs to evaluate the campaign’s business performance.
Including Tier 3 metrics in the main body of a client report adds complexity without adding client understanding. Move them to an appendix or keep them in internal analysis documents.
How Do You Frame Google Ads Data for Non-Technical Clients?
Google Ads performance report data requires translation for non-technical clients. The four most common translation challenges:
CTR. Clients often interpret a CTR below 5% as underperformance. The context: average CTR on Google Search is 6.11% across all industries (WordStream, 2024), but varies from 3.8% for legal services to 10.7% for arts and entertainment. The agency’s role is to provide the industry-specific benchmark, not just the number.
Impression share. “We achieved 72% impression share” means nothing to most clients. “Our ads appeared for 72% of the searches where they were eligible — the remaining 28% were missed due to budget limits” is clear and creates an actionable conversation about budget.
CPC. Average CPC varies from under $1 in some categories to $50+ in legal and financial services. Present CPC with the industry context: “Our average CPC of $8.40 is below the industry average of $11.20 for this category.”
Quality Score. Quality Score drives CPC and position but is a metric most clients do not understand without explanation. Consider including a brief explainer the first time it appears: “Quality Score (1-10) measures Google’s assessment of ad relevance and landing page quality. Higher scores reduce our cost per click. We are currently averaging 7/10, above the 5/10 baseline.”
How Should a Google Ads Performance Report Be Structured?
A complete Google Ads performance report for monthly client delivery:
Page 1: Executive summary Verdict on the month, primary driver of performance (positive or negative), and the top recommendation for the next period.
Page 2: Headline KPI tiles The Tier 1 metrics at large visual weight: conversions, cost per conversion, and ROAS or revenue for ecommerce accounts.
Page 3: Channel performance table and trend Tier 2 metrics in a table with period comparisons. Line chart of conversions and cost per conversion over the past 6-12 months. Written analysis of what drove the period’s performance.
Page 4: Campaign-level performance breakdown Which campaigns performed strongest, which underperformed, and why. This page connects the account-level story to the specific campaign decisions.
Page 5: Recommendations for next period Three to five specific, data-backed recommendations with expected outcomes.
Appendix (optional): Full keyword and ad-level data For clients who want detailed access to the underlying data. Labelled clearly as supplementary.
According to Google’s 2024 benchmark data, campaigns with a clear documented optimisation log (recording changes made and their measured impact) show 28% better performance improvement over 12 months than campaigns managed without systematic documentation. Including a “changes made this month” section in the Google Ads performance report serves both the client and the agency’s own optimisation discipline.
How Do You Automate Google Ads Performance Reporting?
Manual Google Ads performance report production involves: logging into Google Ads, setting the date range, selecting the metrics, exporting the data, cleaning and formatting it, building the charts, and writing the analysis. For 10 clients, this is 15-25 hours per month.
DataMyth automates this process by connecting to Google Ads via API, extracting the Tier 1 and Tier 2 metrics automatically each reporting cycle, and generating the structured report with written analysis of what changed and why. The account manager’s role becomes: reviewing the generated analysis, adding campaign-specific context (what changes were made and why), and writing the recommendations section.
This reduces the Google Ads reporting cycle from 90-150 minutes per client to 15-25 minutes. Connect Google Ads to DataMyth.
What Is the Right Reporting Cadence for Google Ads?
Google Ads performance report cadence should match the client’s campaign budget and the decision-making cycle. Three practical guidelines:
Monthly reporting is the standard for most clients. Monthly cycles provide enough time for meaningful performance changes to accumulate and enough data to draw statistically reliable conclusions about what is and is not working.
Weekly reporting is appropriate for high-budget campaigns (over $30,000/month spend) where performance variations can compound quickly, for ecommerce campaigns during peak seasons (Black Friday, holiday period), or when a significant campaign change is under active evaluation and requires fast feedback.
Bi-weekly reporting is a useful middle ground for clients who want more visibility than monthly but do not have the budget level to justify weekly. A bi-weekly cadence for the primary KPI metrics (conversions, CPL, spend pace) with a full monthly report covers most needs.
For most campaigns, a monthly report with a weekly performance alert system (automated alerts when conversions drop below threshold or CPC spikes above threshold) provides the right balance of regular visibility and strategic reporting depth.
What metrics should a Google Ads performance report include?
Tier 1 (headline): conversions, cost per conversion, ROAS, revenue. Tier 2 (supporting): clicks, CTR, average CPC, impressions, impression share. Tier 3 (internal/appendix only): keyword performance, bid modifier analysis. Most clients need Tier 1 and 2; Tier 3 is for the agency’s optimisation work.
How do I explain CTR to a non-technical client?
Provide the industry benchmark alongside the client’s number: “Our ads clicked 6.8% of the time they appeared, compared to the industry average of 4.2% for our category.” Context makes the number meaningful.
How should I structure a Google Ads client report?
Executive summary, headline KPI tiles, channel performance table and trend chart, campaign-level breakdown, and recommendations. Detailed keyword and ad-level data goes in the appendix for clients who want it.
What is impression share and how do I explain it to clients?
Impression share is the percentage of eligible searches where your ads appeared. “We appeared for 72% of relevant searches; the remaining 28% were missed due to budget limits” is the client-ready version.
How do I automate Google Ads reporting for multiple clients?
Connect your clients’ Google Ads accounts to DataMyth, which extracts the data automatically each cycle and generates the formatted report with written analysis. This reduces 90-150 minutes of manual work per client to 15-25 minutes of review.
Should I include Quality Score in a client report?
Not as a headline metric, but it can be included in the supporting table with a brief explanation. Quality Score is most useful as an internal diagnostic. Include it only if it is relevant to a specific conversation about CPC or position trends.