
Categories
Uncategorized

Can I Schedule Automated Client Reports? Yes, Here’s How

Yes, you can schedule automated client reports. Modern marketing reporting platforms let you connect your client’s channels once, configure a report template, set a delivery schedule, and have the report generate and send automatically, without touching it manually each period. Here is exactly how to do it and what to think through before you set it up.

What Does It Mean to Schedule Automated Client Reports?

Scheduling automated client reports means configuring a reporting system to generate and deliver formatted performance reports at a set interval, weekly, monthly, or quarterly, without requiring manual data export, template updates, or written commentary each time. The system pulls live data from connected channels, applies the report layout, generates any written analysis, and delivers the report (as a link or PDF) to the recipient automatically.

The result: on the first Monday of every month, your client’s report arrives in their inbox without your team spending three hours assembling it.

How Do You Set Up Scheduled Client Report Delivery?

Setting up scheduled automated client reports involves five steps:

Step 1 – Connect data sources. Link your client’s channels, GA4, Google Ads, Facebook Ads, LinkedIn Ads, Google Search Console, to your reporting platform using secure OAuth authentication. This is a one-time setup per client account. No manual exports after this point.

Step 2 – Choose or build a report template. Select a template that matches the client’s reporting needs. A Google Ads-focused report looks different from a cross-channel agency report. Most platforms offer pre-built templates by channel; DataMyth provides channel-specific templates with automated analysis built in.

Step 3 – Configure the reporting period. Set the default date range, last 30 days, last month (calendar), or a custom range. Decide whether it compares to the prior period automatically.

Step 4 – Set the schedule. Choose the delivery frequency: weekly (typically for active testing phases), monthly (default for most client accounts), or quarterly (for strategic review reports). Set the exact delivery day and time. Monday morning delivery works well, clients often review performance at the start of the week.

Step 5 – Set recipients and delivery format. Add the client contact email and any internal stakeholders. Choose between a live link (always shows current data) or a PDF snapshot (fixed at generation time). For most client-facing reports, a PDF snapshot is cleaner, it represents the period as it was when you sent it.

What Should You Automate First in Your Client Reporting Workflow?

Prioritize automating the parts of reporting that consume the most time with the least strategic value:

Reporting taskAutomate?Why
Data export from each platformYes, immediatelyPure mechanical work, no judgment required
Report formatting and layoutYesTemplate-driven, consistent across clients
Period-over-period calculationsYesArithmetic, not analysis
Written performance analysisYes (if tool supports it)Biggest time sink; DataMyth generates this automatically
Strategic recommendationNoRequires account knowledge and judgment
Client communication contextNoRelationship-specific, cannot be templated

The written analysis is the most important item to automate if your tool supports it. Agencies report spending 2–4 hours per client per month writing the “what changed and why” narrative. Automating this, while retaining the strategic recommendation, recovers the majority of reporting time without reducing the value you deliver.

How Often Should Scheduled Client Reports Run?

Monthly is the right default for most client accounts. Monthly cadence gives enough data for meaningful trend analysis, aligns with budget cycles, and gives clients the rhythm they expect. Weekly reports are appropriate during active A/B testing phases or when a client is launching a new campaign and wants frequent visibility. Quarterly reports serve strategy reviews.

The scheduling decision should match how fast the channel moves:

  • Google Ads (active): Weekly during launch, monthly ongoing
  • Facebook Ads (active testing): Weekly or bi-weekly during creative testing, monthly ongoing
  • SEO / organic: Monthly (weekly organic data is mostly noise)
  • LinkedIn Ads: Monthly (B2B sales cycles are too long for meaningful weekly movement)
  • Cross-channel summary: Monthly, with quarterly strategic review

One practical note: schedule the report to generate 24–48 hours before delivery to allow time for a human review. A scheduled report that goes directly to the client without review creates accountability gaps. The scheduling system handles the generation; your team handles the final read and send.

Can You Schedule Automated Client Reports for Multiple Clients at Once?

Yes. A reporting platform built for agencies, like DataMyth, lets you manage multiple client accounts in a single interface, each with its own template, schedule, and recipient list. Adding a new client’s account does not require rebuilding your reporting infrastructure; you connect the channels, apply the template, and configure the schedule in minutes.

This is the scalability argument for automation: the 30th client account costs nearly the same reporting effort as the first, because the system handles the repetitive steps for all of them simultaneously. See how DataMyth handles agency reporting at scale.

Can I schedule automated client reports to go out automatically?

Yes. Connect your client’s data sources to a reporting platform, configure the template and schedule, and the report generates and delivers itself at the set interval, no manual trigger required.

How do I automate monthly client reports for paid media?

Connect your Google Ads and Facebook Ads accounts to a reporting platform. Set a monthly schedule and choose a paid media template that includes spend, conversions, cost per conversion, and ROAS. DataMyth automates the data pull, report generation, and written analysis, so the monthly paid media report produces itself.

What is the best cadence for automated client reports?

Monthly is the right default. Use weekly during active campaign launches or A/B testing phases. Quarterly for strategic reviews. Match the cadence to how fast the channel moves, SEO reports monthly; active paid media can go weekly during testing.

Does scheduling a report replace the account manager?

No. Scheduling automates the data pull, formatting, and written analysis narrative. Strategic recommendations, client relationship management, and account optimization decisions still require human judgment. Automation recovers time so account managers can focus on the work that requires their expertise.

What channels can be included in a scheduled client report?

Most marketing reporting platforms support GA4, Google Ads, Facebook Ads, LinkedIn Ads, and Google Search Console. DataMyth supports all five in a single automated report with written performance analysis.

How long does it take to set up scheduled automated client reports?

Initial setup takes 15–30 minutes per client: connecting channels, selecting the template, configuring the schedule, and adding recipients. After that, the report runs automatically each period with no further input.

Categories
Uncategorized

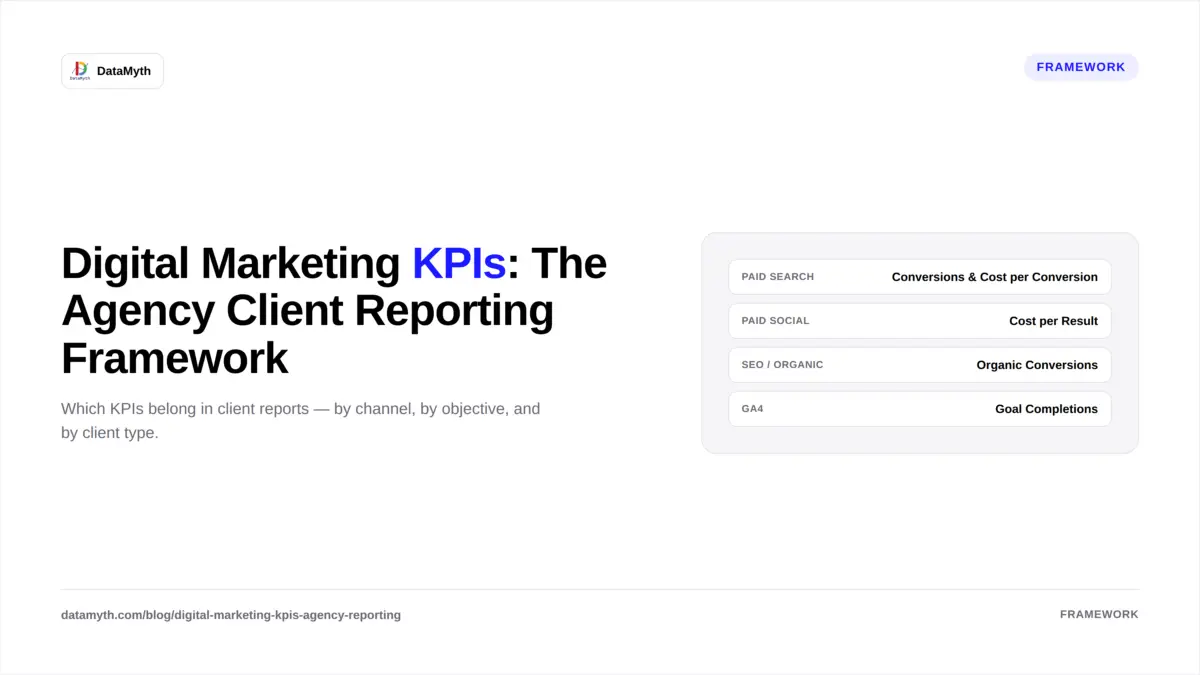
Digital Marketing KPIs: The Agency Client Reporting Framework

Choosing the wrong digital marketing KPIs for a client report is not a minor formatting issue, it’s a trust problem. When a PPC agency reports impressions to a client who needed leads, or an SEO agency highlights keyword rankings to a client who needed revenue, the report technically shows real data while completely failing to demonstrate value.

This framework maps the right KPIs to the right clients by channel, objective, and business type, so every report you send measures what the client actually hired you to deliver.

What Are Digital Marketing KPIs and Why Do They Vary by Client?

Digital marketing KPIs are the specific, measurable indicators that show whether a marketing activity is achieving its business goal. They vary by client because different clients have fundamentally different objectives. A B2B SaaS company measures qualified leads and pipeline contribution. An e-commerce brand measures ROAS and revenue. A local service business measures calls, form fills, and cost per acquisition.

Reporting the same metrics to all three clients treats their businesses as interchangeable. The framework below sets KPIs by channel and overlays business objective filters.

Which Digital Marketing KPIs Matter by Channel?

Paid Search (Google Ads)

Primary KPIs:

  • Conversions (leads, purchases, or calls, match to objective)
  • Cost per Conversion
  • Conversion Rate
  • ROAS (e-commerce only)

Context KPIs (supporting, not headline):

  • Impression Share
  • Average CPC
  • Quality Score trends
  • Search Term match efficiency

Omit from client-facing reports: Average position (deprecated), click volume without conversion context.

Paid Social (Facebook / Meta, LinkedIn)

Primary KPIs:

  • Results (leads, purchases, whatever the campaign objective is)
  • Cost per Result
  • ROAS (e-commerce)
  • Lead Form Completion Rate (LinkedIn / Meta lead campaigns)

Context KPIs:

  • Frequency (creative fatigue signal)
  • Link CTR
  • Demographic breakdown (LinkedIn-specific)

Omit: Reactions, shares, 3-second video views, reach as a success metric.

SEO / Organic Search

Primary KPIs:

  • Organic Sessions
  • Organic Conversions (or assisted conversions)
  • Revenue from Organic (if tracked)
  • Keyword Ranking Movement (for target terms)

Context KPIs:

  • Click-Through Rate from Search Console
  • Impressions trend (Search Console)
  • Backlinks acquired

Omit: Domain authority as a client-facing performance metric (it’s a diagnostic, not an outcome).

Email Marketing

Primary KPIs:

  • Revenue per Email (e-commerce)
  • Conversion Rate
  • List Growth Rate

Context KPIs:

  • Open Rate (directional, not a success metric)
  • Click-to-Open Rate
  • Unsubscribe Rate

Omit: Raw open rates as headline metric, iOS privacy changes have degraded their accuracy.

Google Analytics / GA4 (Cross-Channel)

Primary KPIs:

  • Goal Completions / Key Events
  • Engagement Rate
  • New vs. Returning Users (by channel)
  • Revenue (if GA4 e-commerce is configured)

Context KPIs:

  • Sessions by Channel
  • Average Engagement Time
  • Landing Page performance

How Should Agencies Set KPIs at the Start of a Client Engagement?

Set digital marketing KPIs at the start of every client engagement using a three-question process:

Question 1: What is the client’s business goal? Leads, revenue, brand awareness, retention, the business goal defines the category of KPI.

Question 2: What does success look like numerically? A 20% increase in qualified leads, a CPL under $80, a ROAS above 3.5x. Without a target, a KPI is just a metric.

Question 3: What data can we reliably track? If conversion tracking is not set up, reporting on conversions is misleading. Confirm tracking integrity before setting KPIs you cannot measure.

Document the agreed KPIs in a shared brief and include them in the first section of every monthly report, so the client always sees current performance measured against the goal they signed off on.

What Is the Difference Between a KPI and a Metric?

A metric is any measurable number, impressions, clicks, sessions, opens. A KPI is a metric that has been selected because it is directly tied to a business goal and has a target. Every KPI is a metric, but most metrics are not KPIs.

This distinction matters for reporting. A report that lists every available metric from every platform is not a performance report, it’s a data dump. A report that shows five agreed KPIs versus their targets, with a written analysis of what drove the variance, is a performance report. The latter earns client trust. The former loses it.

How Do You Build a KPI Dashboard for Reporting?

Build a digital marketing KPI dashboard by:

(1) pulling data from your connected channels automatically,

(2) surfacing only the agreed client KPIs in the headline row,

(3) including period-over-period variance for every KPI, and

(4) adding a written performance narrative.

DataMyth automates steps 1, 2, 3, and 4, connecting GA4, Google Ads, Facebook Ads, LinkedIn Ads, and Search Console in a single report that writes the performance analysis automatically. Visit the DataMyth features page or explore the Google Analytics Report and Google Ads Report tools.

What are digital marketing KPIs?

Digital marketing KPIs are specific, measurable indicators tied to a business goal, such as cost per lead, ROAS, or organic conversions. They differ from generic metrics because they have agreed targets and directly reflect whether marketing is achieving the client’s objective.

How many KPIs should a marketing report include?

Most client reports work best with three to five headline KPIs, enough to cover the primary goal without overwhelming non-marketing stakeholders. Support each headline KPI with two or three context metrics, not the full platform data export.

What are the most important digital marketing KPIs for e-commerce?

For e-commerce, the core KPIs are ROAS, cost per purchase, revenue from paid channels, organic revenue, and conversion rate by channel. These directly link marketing spend to revenue outcomes.

What are digital marketing KPIs for B2B?

For B2B, the primary KPIs are qualified leads, cost per lead, lead-to-opportunity rate (if CRM is connected), and pipeline influenced. Supporting KPIs include campaign CTR, cost per click, and demographic quality data (especially for LinkedIn Ads).

How do you choose KPIs for a new marketing client?

Match KPIs to the client’s stated business goal, set a numeric target for each, and confirm that conversion tracking is in place to measure them accurately. Agree on the KPI set in writing before the first report is sent.

How do digital marketing KPIs differ from vanity metrics?

A KPI is tied to a business outcome and has a target. A vanity metric, like impressions, follower count, or raw page views, can increase while business results decline. The test: if the metric went up while revenue, leads, or conversions went down, it is a vanity metric.