
LinkedIn Ads operate differently from every other paid channel, higher CPCs, longer sales cycles, and a buyer audience that demands a different measurement framework. LinkedIn Ads reporting that copies a Facebook Ads template will miss the metrics that actually matter for B2B, and send exactly the wrong signals to clients who expect qualified pipeline, not cheap clicks.
This guide covers the specific metrics that belong in a LinkedIn Ads report, how to structure reporting for non-marketing stakeholders, and how to automate the process so reporting week stops consuming your team.
What Does Effective LinkedIn Ads Reporting Measure?
Effective LinkedIn Ads reporting measures lead quality and pipeline contribution, not just traffic and impressions. LinkedIn CPCs average $5–$7, roughly 5–6x higher than Google Display, which means efficiency metrics like cost-per-click carry far less meaning than cost-per-lead and lead-to-opportunity rate. A report that leads with impressions and CTR is technically accurate but strategically useless for a B2B client who needs to justify a $15,000 monthly LinkedIn budget.
The metrics that belong in every LinkedIn Ads report:
| Metric | What It Measures | Why It Matters for B2B |
|---|---|---|
| Cost per Lead (CPL) | Efficiency of lead generation | Core B2B success metric |
| Lead Volume | Total leads generated | Baseline output |
| Lead Form Completion Rate | Quality of the form experience | Low rate = friction in funnel |
| Click-Through Rate (CTR) | Creative and audience resonance | Indicates message-market fit |
| Cost per Click (CPC) | Bid efficiency | Context for CPL, not headline |
| Impressions & Reach | Brand awareness reach | Supporting context only |
| Frequency | How often same person sees ad | Guards against audience fatigue |
| Conversion Rate (post-click) | Lead page effectiveness | Diagnoses landing page issues |
| Pipeline Influenced (if CRM connected) | Revenue attribution | Ultimate B2B proof of value |
How Should Agencies Structure a LinkedIn Ads Report for Non-Marketing Clients?
Structure a LinkedIn Ads report for non-marketing stakeholders by leading with business outcomes, leads and pipeline, before any platform metrics. Non-marketing decision-makers, a VP of Sales, a CFO, a CEO, do not care what your CPM was. They care whether LinkedIn produced conversations with the right people.
A proven structure for LinkedIn agency reports:
1. Executive summary (half page): Total spend, total leads, CPL, and one sentence on trend vs. prior period.
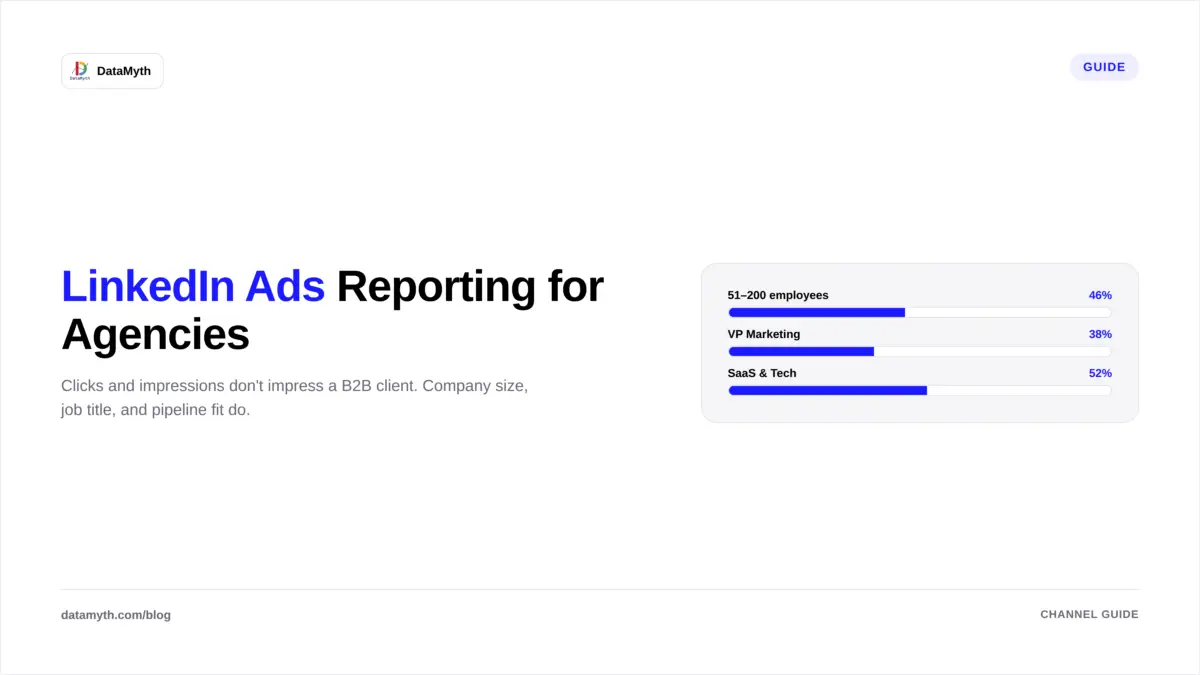
2. Lead quality section: Breakdown by job title, seniority, and company size if you’re using LinkedIn’s demographic filters. This is the uniquely valuable data LinkedIn provides that Google and Meta cannot — company-level targeting insight.
3. Campaign performance table: Campaigns ranked by CPL, with budget, impressions, clicks, leads, and spend per lead.
4. Creative performance: Top and bottom ad by CTR and conversion rate. One clear recommendation on which creative to scale or pause.
5. Written analysis: What changed from last period and the most likely reason, ranked by impact. This is the section that takes the longest to write manually, and the section that demonstrates your agency’s strategic value.
6. Recommendation: One or two concrete actions for next period.
Why LinkedIn Audience Demographics Make It Unique for Reporting
LinkedIn is the only paid channel that lets you report on who saw your ad at a professional level. Company name, job function, seniority, industry, and company size are all available in Campaign Manager’s demographic breakdowns. This data belongs in your LinkedIn Ads reporting because it answers the question clients actually care about: “Are we reaching the right people?”
If a campaign targeting VP-level finance decision-makers at companies over 1,000 employees is generating leads but the demographic report shows 60% of leads came from individual contributors at 50-person startups, the leads are misqualified, and the campaign strategy needs to change. No other ad platform surfaces this diagnosis as clearly.
Include a demographic breakdown table every reporting period and annotate any audience drift. This practice, consistently applied, is what separates a data-delivery agency from a strategic partner.
What Should a LinkedIn Ads Dashboard Include?
A LinkedIn Ads dashboard for real-time monitoring should include: live CPL, lead volume vs. target, spend pacing (daily burn rate vs. budget), frequency by campaign, and a creative performance summary. Keep it to six or seven tiles maximum.
Daily monitoring focuses on spend pacing and frequency. Weekly, check CPL trends and creative fatigue signals (frequency above 3–4 typically depresses CTR). Monthly, the full report goes out with demographic breakdown and written analysis.
The dashboard and the report serve different purposes. The dashboard tells you whether anything needs an immediate intervention. The report tells the client what the month meant and what to do next.
How Do You Automate LinkedIn Ads Reporting?
Automate LinkedIn Ads reporting by connecting your Campaign Manager account to a reporting platform that pulls data automatically, applies a consistent template, and generates the written analysis of what changed and why.
DataMyth connects to LinkedIn Ads and generates the full written analysis, including the performance narrative and impact ranking, automatically, so the report is ready to send without your team spending hours in spreadsheets. See how the LinkedIn Ads Report works.
The practical automation checklist:
- Connect Campaign Manager once (OAuth, no manual exports)
- Set a reporting template that matches your client’s audience (business-outcome-first)
- Schedule monthly delivery with automated written analysis
- Reserve your team’s time for the demographic review and strategic recommendation, the parts that require human judgment
What metrics should a LinkedIn Ads report include?
A LinkedIn Ads report should lead with cost per lead, lead volume, and lead form completion rate. Support these with CTR, CPC, and frequency. Include a demographic breakdown (job title, seniority, company size) and a written analysis of what changed compared to the prior period.
How is LinkedIn Ads reporting different from Facebook Ads reporting?
LinkedIn Ads reporting prioritizes lead quality and B2B demographic targeting data over volume metrics like impressions and reach. LinkedIn CPCs are significantly higher, so the efficiency metric that matters is cost per qualified lead, not cost per click. Facebook reporting focuses more on ROAS, frequency, and creative testing at scale.
What is a LinkedIn Ads reporting tool?
A LinkedIn Ads reporting tool connects to Campaign Manager, pulls performance data automatically, and generates formatted reports, ideally with written analysis of what drove changes. DataMyth is one such tool, providing automated LinkedIn Ads reports with performance insights built in.
How often should agencies send LinkedIn Ads reports?
Most B2B agencies send LinkedIn Ads reports monthly, with a lighter weekly check-in during active campaign testing. Monthly is the right cadence for stakeholder reporting because LinkedIn’s longer sales cycles mean weekly data often lacks enough signal to act on.
Can you automate a LinkedIn Ads report?
Yes. Connect your LinkedIn Ads account to a marketing reporting platform, set your template and schedule, and the report generates automatically each period. The automated analysis, explaining what changed and why, is what separates useful automated reports from plain data exports.
What demographic data can I include in a LinkedIn Ads report?
LinkedIn Campaign Manager provides demographic breakdowns by job title, job function, seniority level, company name, company size, industry, and location. Including a demographic section in your report is what distinguishes LinkedIn reporting from other channels, it answers whether you reached the right people, not just whether people clicked.f