LinkedIn Ads reporting looks deceptively similar to Google or Facebook reporting until you actually build one, and then the differences show up fast: B2B sales cycles are longer, CPCs are higher, and the audience data (job title, seniority, company size) is uniquely valuable and easy to bury in a generic dashboard. This guide covers how to structure LinkedIn ads reporting properly, from the metrics that matter to how often to send it.
Why LinkedIn Ads Reporting Needs a Different Approach
Most paid reporting templates default to impressions, clicks, and CTR, metrics built for high-volume, low-CPC platforms. LinkedIn ads reporting works differently because the platform’s real strength is audience precision, not volume. A good LinkedIn ads report leads with lead quality and demographic targeting data, not raw reach.
Core Sections of a LinkedIn Ads Report
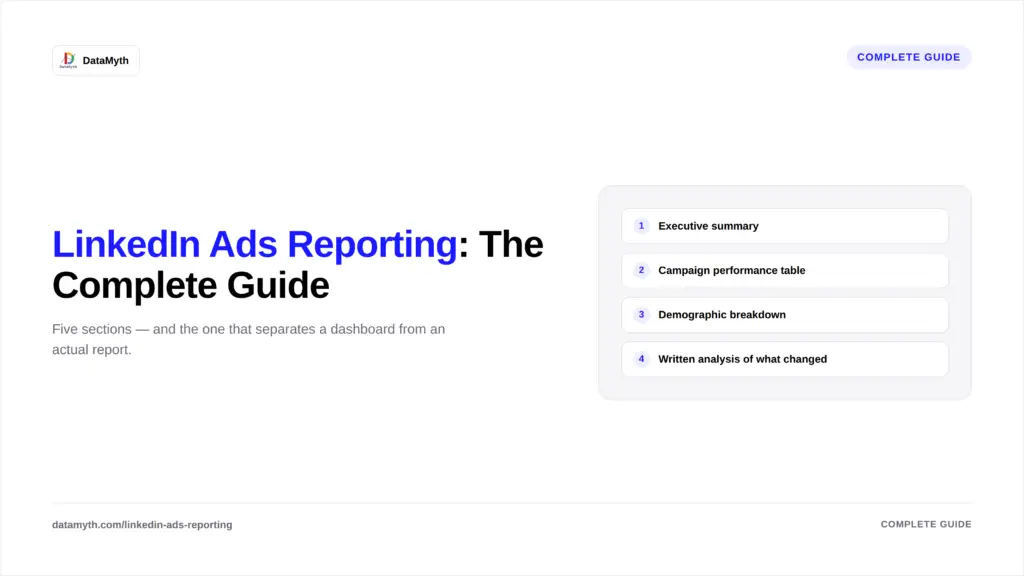
1. Executive summary
Total spend, total leads, cost per lead, and one line on the trend versus the prior period. Non-marketing stakeholders should be able to read just this section and understand performance.
2. Campaign performance table
3. Demographic breakdown
Performance by job title, seniority, and company size, LinkedIn’s uniquely valuable targeting data that platforms like Google and Meta simply don’t offer at the same depth.
4. Creative performance
Top and bottom-performing ads by CTR and conversion rate, with a clear recommendation on what to scale or pause.
5. Written analysis of what changed
This is the step that separates a
LinkedIn ads dashboard from an actual report. A table of numbers still requires someone to explain the “why.” DataMyth’s
LinkedIn Ads report generates that written performance analysis automatically, ranked by degree of impact, so the report is ready to send without hours of manual commentary.
LinkedIn Ads Reporting Metrics That Actually Matter
– Cost per lead (CPL) — the primary efficiency metric, more relevant than CPC for most B2B campaigns
– Lead form completion rate — flags friction in the conversion step itself
– CTR and CPC — useful as supporting metrics, not headline ones
– Frequency — high frequency on a small audience often signals fatigue before CTR drops
– Cost per qualified lead — where possible, layering in lead quality data (not just volume) from your CRM
Building the LinkedIn Ads Dashboard
1. Connect Campaign Manager to your reporting tool via API so data refreshes automatically rather than requiring manual export.
2. Set the comparison period (month-over-month is standard for B2B given longer sales cycles).
3. Prioritize demographic data in the layout, this is the section clients ask about most since it’s unavailable elsewhere.
4.
Automate the written narrative so account managers aren’t manually drafting commentary every reporting cycle. DataMyth’s
LinkedIn Ads dashboard template is a ready-built starting point.
Common Mistakes in LinkedIn Ads Reporting
A handful of recurring errors show up across most LinkedIn ads reporting setups. Leading with CTR or CPC as the headline metric is the most common, since those numbers almost always look worse than a Google Ads or Facebook Ads equivalent and can make a genuinely healthy campaign appear to be underperforming to a client who isn’t expecting the difference. Ignoring frequency until CTR has already declined is another, on LinkedIn’s smaller, more precisely targeted audiences, frequency climbs faster than on broad consumer platforms, and catching it early prevents unnecessary budget waste on an audience that’s already seen the ad enough times. Finally, treating every lead as equal in the report, without any quality signal from the CRM, tends to overstate or understate a campaign’s real impact, since a campaign generating fewer, higher-quality leads can be outperforming one generating more, lower-quality leads even though the raw lead count says otherwise.
Structuring LinkedIn Ads Reporting for Different Stakeholders
The same underlying LinkedIn ads reporting data often needs to be presented differently depending on who’s reading it. A CMO or VP of Marketing typically wants the executive summary and campaign table, focused on efficiency and trend. A sales leader cares most about the demographic breakdown and lead quality, since that’s what determines whether marketing is actually reaching the accounts sales wants to talk to. A CFO or finance stakeholder wants spend and cost-per-lead trends tied clearly to budget, with minimal platform jargon. Building one underlying dataset with a few different presentation views, rather than three separate manual reports, is how agencies keep this manageable without tripling their reporting workload.
LinkedIn Ads Reporting for Different Campaign Objectives
Not every LinkedIn campaign is optimizing for lead generation directly, and the report structure should reflect that. Brand awareness campaigns should lead with reach, frequency, and video view rate rather than cost per lead, since lead generation isn’t the immediate goal. Website visit campaigns sit in between, useful to track click-through rate and landing page engagement alongside softer conversion signals like time on site. Lead generation campaigns, the most common use case for LinkedIn ads reports, should follow the cost-per-lead-first structure covered above. Mixing objectives into one undifferentiated report, treating an awareness campaign’s low CTR the same way as a lead-gen campaign’s low CTR, is one of the more subtle ways LinkedIn ads reporting goes wrong even when the individual metrics are accurate.
How Often Should LinkedIn Ads Reports Go Out?
Monthly is standard for most B2B accounts, given longer consideration cycles and lower daily data volume compared to consumer platforms. Weekly reporting is worth considering only during active testing phases or new campaign launches.
LinkedIn Ads Reporting vs. Other Channels
LinkedIn ads reporting differs most from Google or Facebook reporting in what counts as a “good” number, a CPC that looks alarming on Google Ads is often normal on LinkedIn given the audience precision being paid for. See our full comparison in LinkedIn Ads vs Google Ads reporting for how the two report structures actually diverge.
LinkedIn’s own Marketing Solutions resources note that B2B buying committees increasingly involve five or more stakeholders, reinforcing why demographic and seniority breakdowns matter more in LinkedIn reporting than in most other paid channels.