Pulling numbers out of Campaign Manager is the easy part. Turning them into a LinkedIn Ads performance report a client understands without a follow-up call, that’s the part that actually takes time. Here’s the process step by step, from data export to final delivery, for anyone looking to create a LinkedIn Ads report that actually gets read.
Step 1: Pull the Right Data From Campaign Manager
Start in LinkedIn Campaign Manager’s Performance tab and export at the campaign level, not just the account level. A LinkedIn ads report that only shows account totals hides which specific campaigns are working, which is usually the thing a client actually wants to know. Exporting at the ad level as well, at least for review purposes, also helps catch creative fatigue early, before it shows up as a dip in the campaign-level numbers.
Key fields to pull:
– Spend, impressions, clicks, CTR, CPC
– Leads and lead form completion rate
– Demographic breakdown (job title, seniority, company size, industry)
Step 2: Choose a Consistent Comparison Period
LinkedIn campaign reporting without a comparison period is just a static snapshot. Set month-over-month as the default given B2B’s typically longer sales cycles, and use it consistently across every LinkedIn ads report so trend direction is always readable at a glance.
Step 3: Structure the Report Around Business Outcomes First
Lead with cost per lead and lead volume, not impressions or CTR. Stakeholders outside the marketing team, a VP of Sales, a CFO, care whether the campaign produced conversations with the right people, not what the CPM was. This ordering matters as much as the data itself, and it’s a common reason a technically accurate report still fails to land: the numbers are right, but the order buries the answer to the question the client actually asked.
A workable structure:
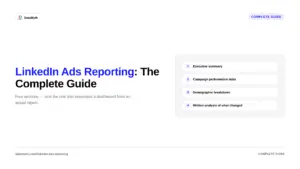
1. Executive summary (spend, leads, CPL, one-line trend)
2. Lead quality by job title, seniority, and company size
3. Campaign table ranked by cost per lead
4. Creative performance (top and bottom ad by CTR)
5. Written analysis and recommendation
Step 4: Add the Demographic Layer
This is what makes a LinkedIn ads report genuinely different from a Google or Facebook report. LinkedIn’s targeting data, job function, seniority, company size, is data your other channels simply can’t provide. Skipping this section wastes the platform’s biggest reporting advantage.
Step 5: Write (or Automate) the Analysis
Every LinkedIn ads report eventually needs someone to explain
why cost per lead moved, or why one campaign outperformed another. Doing this manually every reporting cycle is the single biggest time cost in the process. DataMyth’s
LinkedIn Ads report generates this written analysis automatically, identifying the KPIs with the most significant impact and explaining the likely cause in plain language, cutting a process that typically takes hours down to a quick review.
Sanity-Check the Numbers Before Sending
Before a LinkedIn Ads performance report goes out, run a quick internal check against a few common data issues. Confirm the currency and time zone settings in Campaign Manager match what’s expected, exports pulled with the wrong default currency have quietly derailed more than one client report. Check that paused or ended campaigns from earlier in the period are still included in the comparison rather than silently excluded, which can make total spend or lead volume look artificially low. And verify that conversion tracking (via the LinkedIn Insight Tag) was active for the full reporting window, a tag that was only installed partway through the month will understate lead volume for that period in a way that has nothing to do with actual campaign performance.
Handling Small Sample Sizes in LinkedIn Ads Data
LinkedIn’s smaller, more precisely targeted audiences mean campaign-level data can be noisier than the equivalent on Google or Facebook, especially for newer accounts or narrow audience segments. A campaign that generated three leads last month and one this month isn’t necessarily down 67%, it may just be normal variance at low volume. When building a LinkedIn Ads performance report, it’s worth aggregating small campaigns into a combined line rather than reporting each individually if volume is too low to show a meaningful trend on its own, and calling out explicitly when a swing is likely noise rather than a real shift in performance. Clients tend to trust reports more, not less, when the report itself flags this kind of nuance rather than presenting every number with false precision.
Step 6: Deliver on a Fixed Schedule
Monthly reporting is standard for most B2B LinkedIn accounts. If reporting for several clients at once, see our guide on how to
automate marketing reports for multiple clients to avoid rebuilding this process from scratch for each account.
A Faster Path: Starting From a Template
Rather than building the structure above from a blank spreadsheet, DataMyth’s
LinkedIn Ads dashboard templatealready includes all six sections, with automated written analysis built in.
LinkedIn’s Campaign Manager help documentation recommends reviewing demographic performance regularly rather than only at the end of a campaign, since audience-level insights often surface optimization opportunities before overall CTR or CPC trends make them obvious.
Quick Recap: Creating a LinkedIn Ads Performance Report
To create a LinkedIn Ads performance report that clients actually read, pull campaign-level data from Campaign Manager, lead with cost per lead rather than impressions, include the demographic breakdown LinkedIn uniquely offers, and automate the written analysis so building the linkedin ads report doesn’t eat hours every cycle. A well-structured linkedin ads performance report should answer “is this working” in the first paragraph, not the last page.