
Marketing report examples from strong agencies share a set of structural and content characteristics that are consistently present and consistently absent from reports that underperform on client satisfaction. Looking at what the best reports include, and annotating why it works, is more useful for improving your own reporting than any general advice about “being more strategic.”
This guide breaks down the key sections of strong marketing report examples and examines what makes each one effective.
What Does a Strong Executive Summary Look Like?
The executive summary is the highest-read section of any marketing report and the most commonly wasted. Strong marketing report examples use the executive summary to communicate three things only: the verdict, the primary driver, and the recommendation.
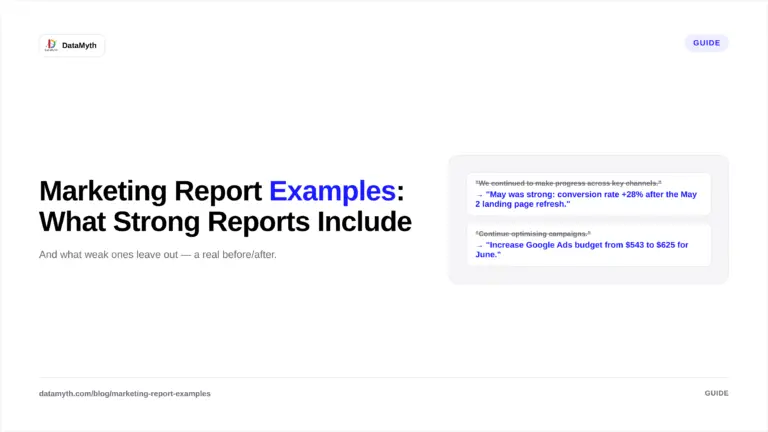
Weak executive summary example: “This month we continued to make progress across the key channels and saw some improvements in performance metrics overall. We are monitoring several areas and will continue to optimise going forward.”
What is wrong: No verdict. No specific data. No recommendation. The client cannot determine from this summary whether the month was good or bad, what caused any change, or what is happening next.
Strong executive summary example: “May was a strong month, driven by a 28% increase in Google Ads conversion rate following the landing page refresh we implemented on May 2nd. Total leads generated reached 47, above the monthly target of 40. Organic traffic continues to grow (up 14% year-over-year) as a result of the four long-form articles published in Q1. For June, we recommend increasing the Google Ads budget by 15% to capitalise on the improved conversion rate while competitive CPCs remain below seasonal average.”
What works: Specific verdict (strong month). Specific cause (landing page refresh, with date). Specific data against target (47 vs target 40). Specific YoY context for organic. Specific recommendation with rationale and timing.
The executive summary should be 150-250 words, specific enough that a client reading only this section understands the period’s performance and the proposed next action.
What Does a Strong Channel Performance Section Look Like?
Marketing report examples with strong channel sections follow a consistent structure: headline metric (large, with comparison), supporting metrics table, trend chart, and written analysis.
Annotated paid search channel section
Headline metric (large KPI tile): Conversions: 47 (vs 38 prior month, +24%)
Supporting metrics table:
| Metric | This month | Last month | Change |
|---|---|---|---|
| Impressions | 124,000 | 118,000 | +5% |
| Clicks | 3,890 | 3,650 | +6.6% |
| CTR | 3.1% | 3.1% | 0% |
| Avg CPC | $4.20 | $4.40 | -4.5% |
| Conversions | 47 | 38 | +23.7% |
| Conversion rate | 1.21% | 1.04% | +16.3% |
| Cost per conversion | $347 | $430 | -19.3% |
| Total spend | $16,300 | $16,340 | -0.2% |
Trend chart: Line chart: Conversions and Cost per Conversion over 12 months (both lines, labelled clearly)
Written analysis (the most important part): “Conversion rate improved from 1.04% to 1.21% this month, driving 9 additional conversions at effectively the same spend level. The primary driver was the updated landing page launched May 2nd, which improved form completion by 18% in the first two weeks. CTR was flat month-over-month, suggesting the ad copy is performing consistently, no creative refresh is needed this cycle. CPC decreased slightly as two higher-bid competitors appear to have reduced spend, creating more efficient auction conditions. We will monitor CPC in June as seasonal competition typically increases in the second half of the year.”
What makes this analysis strong: it attributes the improvement to a specific cause (landing page, with date), quantifies the specific improvement, explains what did not change and why (flat CTR, no action needed), and identifies an emerging risk (seasonal CPC increase) to monitor.
What Does a Strong Recommendations Section Look Like?
Marketing report examples that drive strong client trust include a recommendations section that is specific, data-backed, and forward-looking. Weak recommendations sections are vague or absent entirely.
Weak recommendations:
- “Continue optimising campaigns”
- “Test new creative”
- “Monitor performance”
These are not recommendations. They are descriptions of what an agency always does.
Strong recommendations:
Recommendation 1: Increase Google Ads daily budget from $543 to $625 for June. Rationale: Conversion rate improved 16% in May with no increase in spend. Budget increase will capture additional conversion volume while the improved rate persists. Current search impression share is 68%; budget increase will address the 32% of eligible queries currently missed. Expected outcome: Projected 12-15 additional conversions at the improved CPL of $347. Action required: Client approval for budget increase.
Recommendation 2: Publish two additional blog articles targeting [keyword cluster] in June. Rationale: The four articles published in Q1 have produced 14% YoY organic traffic growth. The next topic cluster in the content calendar (identified in Q1 strategy session) targets queries with 2,400 monthly search volume and no current ranking content. Expected outcome: Initial ranking signals within 30-60 days; traffic contribution visible in August reporting. Action required: Agency writing, client review for factual accuracy.
Strong recommendations include: what to do, why (with specific data), expected outcome, and who needs to do something. Each recommendation is actionable within the next reporting period.
What Does Good Written Analysis Look Like in a Marketing Report?
Across marketing report examples from high-performing agencies, the written analysis follows a consistent pattern:
What changed: One sentence naming the metric and the direction of movement. “Organic sessions from branded search increased 32% month-over-month.”
Why it changed: One to two sentences attributing the cause. “The increase correlates with the LinkedIn thought leadership campaign that ran from May 5-20, which generated 2,400 new profile visits and 140 website clicks from LinkedIn directly.”
What it means: One sentence connecting the data to the client’s goal. “This suggests the awareness campaign is building brand recognition among the target professional audience and driving them to research the brand directly.”
What happens next: One sentence forward-looking. “We expect this trend to continue through June as the LinkedIn campaign continues, with a potential plateau in July when the campaign budget resets.”
This four-sentence framework applies to every metric section in the report. It takes 3-4 minutes per metric section to write and transforms the report from a data delivery into an analytical service.
How Do You Handle Negative Results in a Marketing Data Presentation?
Presenting marketing data that shows underperformance is the moment that most separates strong agencies from weak ones. The instinct is to minimise the bad news, lead with positive metrics, bury the underperformance in a secondary section, or frame it as “an area of opportunity.”
The correct approach is the opposite: acknowledge the underperformance directly in the executive summary, explain the cause specifically, and present a corrective action with a timeline.
A client who reads a report that honestly presents a difficult month and provides a clear explanation and action plan trusts the agency more, not less. The trust damage comes not from the bad result but from discovering that the agency knew about the problem and did not say so.
The language for presenting underperformance should be direct but not catastrophising: “Cost per lead increased 32% month-over-month, driven by [specific cause]. We are implementing [specific action] to address this, with results visible in the June reporting cycle.” Specific, owned, forward-looking.
DataMyth generates this four-part analysis automatically for each channel’s performance data, producing the written narrative as a starting draft that the account manager reviews and refines. The time saving is substantial — from 60-90 minutes of analysis writing per client to 15-20 minutes of review and editing. See DataMyth’s written analysis generation.