
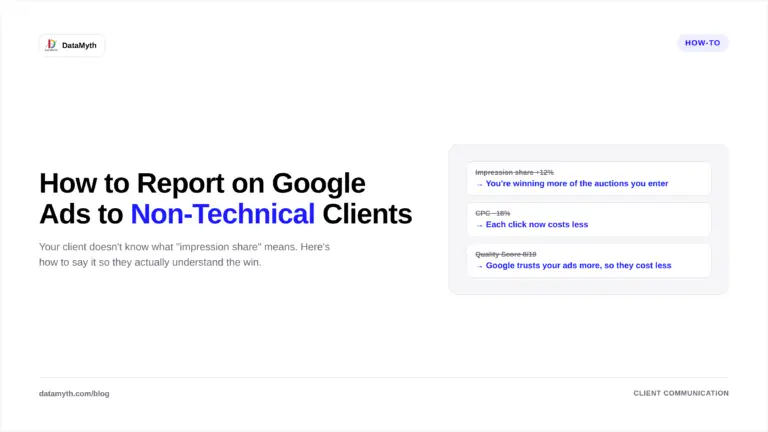
Your Google Ads account is a dashboard of impressions, CTR, CPC, quality scores, and conversion columns that make perfect sense to you and none to your client. The gap between what you understand and what they understand is where trust either builds or breaks. Good Google Ads reporting for non-technical clients is not about showing everything you know; it is about translating performance into terms a business owner actually cares about. Here is how to bridge that gap.
Remember what the client is really asking
Behind every reporting relationship is one unspoken question from the client: is this money working? They are not asking about quality score or impression share. They are asking whether the budget they hand you is producing results they can feel, leads, sales, growth. Every choice in your Google Ads reporting should serve that question.
When you lead with metrics that answer it, the client relaxes. When you lead with jargon, they tense up, even if the numbers are good, because they cannot tell whether the numbers are good. Clarity is what builds confidence.
Lead with outcomes, not activity
The most common mistake in reporting to non-technical clients is opening with activity metrics, impressions, clicks, CTR, before getting to outcomes. Those are the numbers that matter to you as the operator, but to the client they are means, not ends. Flip the order.
Start every report with the outcomes: how many leads or sales the campaign produced, what each one cost, and how that compares to before. Then, only if useful, explain the activity metrics that drove those outcomes. Leading with results tells the client immediately whether their money worked, and everything after that becomes supporting detail rather than confusing preamble. A strong campaign performance report answers the value question in its first few lines.
Translate the jargon
When you do need to reference technical metrics, translate them. Every PPC term has a plain-language equivalent that a business owner grasps instantly:
- Impressions become “how many times your ad was seen.”
- CTR becomes “how often people who saw the ad clicked it.”
- CPC becomes “what you paid for each visit to your site.”
- Conversion rate becomes “how often those visits turned into leads.”
- CPA becomes “what each lead or sale cost you.”
Building this translation into your PPC report does two things. It makes the report readable, and it subtly educates the client, so over time they become better partners who understand what you are optimizing toward.
Show the trend, not just the snapshot
A single period’s numbers mean little to a client with no baseline. Is a $40 cost per lead good? They have no idea unless you show them last month was $55. Context turns a number into a story, and trends are the clearest context you can give.
Always frame Google Ads reporting against a comparison: this period versus last, or against the target you agreed on. A client who sees cost per lead falling and conversions rising understands progress even if they never learn what CPA stands for. The direction of travel communicates far more than any single figure.
Explain the why, not just the what
This is where most reports fall short and where trust is genuinely won or lost. A client who sees leads dropped does not want a chart; they want to know why, and what you are doing about it. A report that shows a decline without explanation reads as a problem you have not noticed. The same decline, paired with “leads dipped because a competitor raised bids on our top keyword, so we shifted budget to a better-performing campaign,” reads as a professional in control.
Providing that ad spend explanation in plain writing is the difference between a client who worries and a client who trusts. This is precisely the work that automated analysis can carry: DataMyth generates the written explanation of what changed in the account and the likely reason based on the degree of impact, so every report arrives with the why already attached rather than leaving the account manager to write it from scratch.
Keep it short and scannable
Non-technical clients do not read long reports; they skim them. A twelve-page PDF of every metric signals thoroughness to you and overwhelm to them. Give them a short report that answers the value question up front, shows the trend, explains the why, and stops. If they want more detail, they will ask.
Respecting the client’s time is itself a form of communication. A tight, clear report says you understand what matters. A sprawling one says you are showing your work rather than serving their needs.
Reporting is a relationship
The best Google Ads reporting for non-technical clients is not a data exercise, it is a communication one. Lead with outcomes, translate the jargon, show the trend, and always explain the why. Do that consistently and reports stop being a monthly chore that raises questions and start being the thing that keeps clients confident, retained, and referring you to others. In client work, a report the client actually understands is worth more than a dozen they do not.
How do I explain Google Ads results to a non-technical client?
Lead with outcomes, leads and sales and their cost, before any activity metrics. Translate technical terms into plain language, show trends against a comparison, and always explain why performance changed, not just that it did.
Which Google Ads metrics matter most to clients?
Clients care about outcomes: how many leads or sales the campaign produced, what each cost (CPA), and how that compares to previous periods or targets. Activity metrics like impressions and CTR are supporting detail, not the headline.
How long should a Google Ads report be?
Short and scannable. Non-technical clients skim, so answer the value question up front, show the trend, explain the why, and stop. Offer deeper detail only if the client asks for it.
How do I explain a drop in performance without losing the client?
Pair the decline with a clear reason and your response, for example a competitor raising bids and how you reallocated budget. An explained dip reads as control; an unexplained one reads as a problem you missed.