Performance reports carry more weight than a quick status update, they’re where clients decide whether the campaign, and the agency, is working. That’s exactly why manually building them is so expensive: pulling data from four platforms, cross-checking numbers, and writing a coherent analysis can eat half a day per client. Here’s how to automate client performance reports without losing the quality clients expect. Whether you manage two accounts or two hundred, the process to automate client performance reports stays largely the same, only the scale changes.
A status report is a snapshot. A performance report has to explain trends over time, tie results back to goals, and usually needs a written narrative a client can act on, which is why teams look to automate client performance reports specifically rather than treating all reporting as one task. Client performance reporting done manually means someone is reading a chart and translating it into English every single month, for every single account.
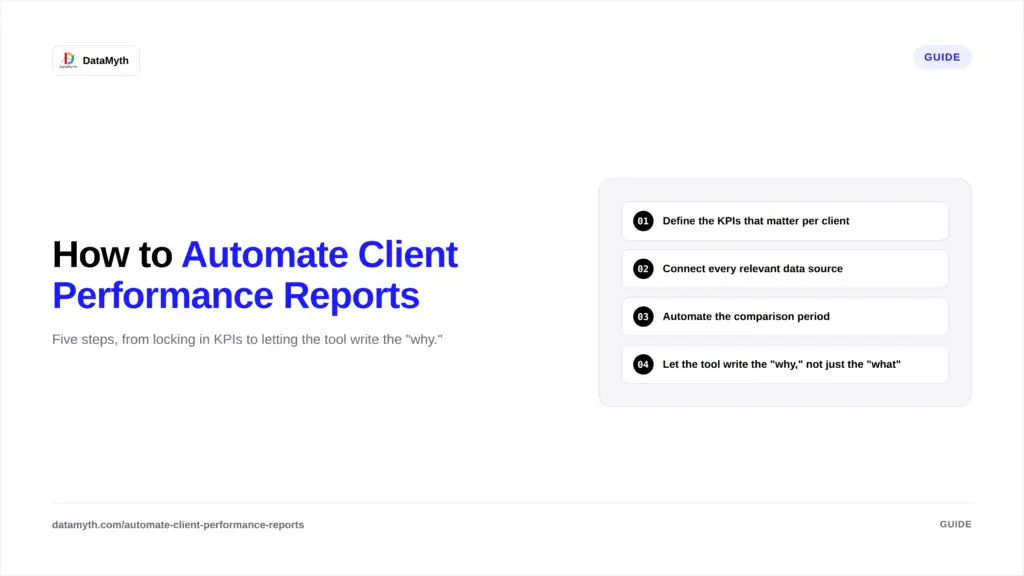
Before building any automated performance reports, lock in three to five headline metrics per account (cost per lead, ROAS, organic conversions, etc.). Automating the wrong metrics just makes bad reporting faster. DataMyth’s guide on digital marketing KPIs for agency reporting is a useful starting point if this step isn’t locked in yet.
Link GA4, Google Ads, Facebook Ads, LinkedIn Ads, and Google Search Console through secure OAuth connections once, so the platform pulls fresh numbers automatically each cycle instead of someone exporting CSVs.
A number without context is meaningless to a client. Automated systems should compare the current period against the prior period (or the prior year) by default, so trend direction is visible without manual calculation.
This is where most reporting automation stops short. Dashboards show what changed; they rarely explain why. DataMyth’s automated analysis engine identifies which KPI moved the most and generates a written explanation of the likely cause, closing the gap between a chart and an actual automated client report a client can read without a call.
Create a performance report template per channel or client tier (SEO-only, paid-media, full-funnel) so scaling to a new client means assigning a template, not building a new report from zero.
Together, these five steps are the fastest route to fully automated performance reports, not partial automation that still leaves the written analysis to a person.
Even agencies that automate client performance reports still run into a handful of recurring problems:
A genuinely automated client report should pass a simple test: could a new account manager, unfamiliar with the client, read it and understand what happened and why without asking anyone a question? If the answer is no, the automation is only handling the data pull, not the analysis, which is usually the more time-consuming half of the job. Reports that still require someone to “translate” the chart before sending it haven’t actually automated client performance reports, they’ve automated the easy 30% and left the hard 70% manual.
Manually assembling a performance report typically takes agencies 1–3 hours per client per month, most of it spent in the “write the commentary” phase rather than pulling the data itself. Automating both the data pull and the written analysis is what actually compresses that time, tools that only automate the dashboard still leave the slowest part, the writing, to a person. For a full breakdown of that gap, see manual vs. automated client reporting.
Automating one client’s performance report is useful. Automating the process across your entire client roster is what actually returns hours to your team’s week. If you’re managing reporting across a large client list, pair this with our guide on how to automate marketing reports for multiple clients.
Search Engine Land’s ongoing coverage of marketing measurement trends consistently points to the same conclusion: agencies that spend less time compiling reports spend more time on strategy, which is the actual differentiator clients pay for.
To automate client performance reports well, lock in the KPIs first, connect data sources once, automate both the comparison period and the written analysis, and reuse the same template across similar accounts. Agencies that only automate the dashboard and skip the analysis still end up writing automated client reports by hand every month, the real time savings in client performance reporting come from automating the narrative, not just the numbers.