Categories
Analysis

Your Objectives Drive Your Google Ads Optimization

Your paid search campaigns can do wonders for you to meet your goals. To see the best result from your Google Ads campaign, it is necessary that you start with an objective in mind. Your objective could either be to drive visibility with impressions or drive demand by generating leads with a form fill. Based on your objective, it is imperative that you select the right KPIs and analyze the data to define your next steps to optimize the campaign.

Brand Awareness:

Brand awareness campaigns aren’t just about driving impressions and traffic to your website – It is about driving relevant impressions and traffic, which reduces the “easy to run-ness” of an awareness campaign. Every impression you get is valuable, so the relevance has to be controlled to ensure that your subsequent KPIs like CTR and clicks aren’t affected.

These are some ways you can control the equality of your traffic:

  • Check the relevance of keywords that drive high impressions. Even though you would have added it to the account, once you have data, check for the volume of impressions v/s its relevance/priority
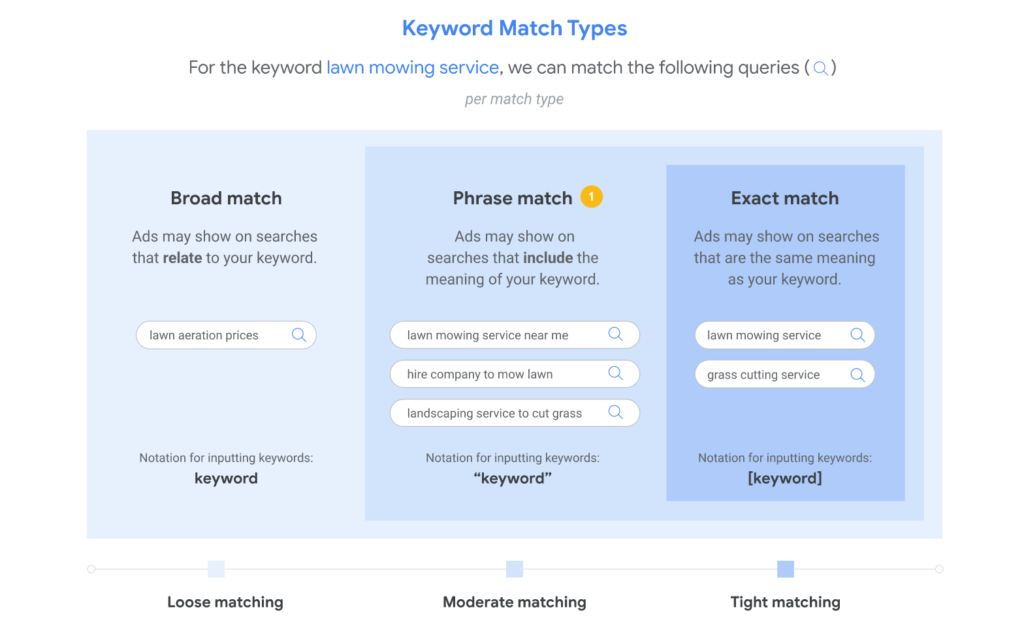
  • Check the search terms, which basically are the keywords your ad shows up for. This is a great source to weed out irrelevant traffic and identify new keywords. For example, if you have a keyword “Red Shoes” as a phrase match in your account, your ads will show up for ‘buy red shoes’, ‘red shoes movie’, ‘red shoes children’, ‘red shoes no laces’, etc. 
    • If you sell shoes, you wouldn’t want to show up for any keyword related to a movie. As a next step, you will add the term ‘movie’ as a phrase match negative keyword
    • If ‘red shoes no laces’ is relevant to you and the keyword has a search volume, you can add it to your account in phrase or exact match.

Keyword relevance also helps reduce your cost by lowering your CPC as a result of a better quality score.

Lead Generation:

Lead Generation campaigns are pretty tricky to optimize. Clients/stakeholders set objectives to generate leads either at a target CPL (cost per lead) or a monthly lead target or both. So the focus will be on keywords generating leads within the said CPL target. 

There are a few things that can be considered if the CPL is over the target – 

  • Identify keywords with CPLs more than the target (more than 1.5x of the target) & keywords which spend more than 2x of the CPL without generating leads.
  • Check keyword search terms & see if any search terms drive a high cost but no conversion or high CPL search terms. Add them as a negative keyword to reduce the cost down of the keyword
  • Check the keyword CTR. If it is low check the search terms again and identify irrelevant terms and add them as a negative to improve the CTR
  • If the CTR is good (above the account average or industry benchmark), but the Conversion Rate is bad, it translates to a good keyword to ad copy relevance, but the experience on the landing page needs to be fixed. Optimize the content & elements on the landing page. Conduct A/B tests to understand what works for your business.
  • Check the hourly report over a period of time to see if there is a particular time where the spend is high but visitors are not converting. You can schedule your ads based on the performance by hour
  • Check for trends or seasonality which could impact your campaign performance

Steps to consider if the keywords are generating leads at a CPL equal to or less than the target CPL.

  1. Check the ‘Search Term’ report to identify the terms that are generating the leads. If you find any new terms, add it to your keyword list so that your ads appear for this keyword at a higher frequency
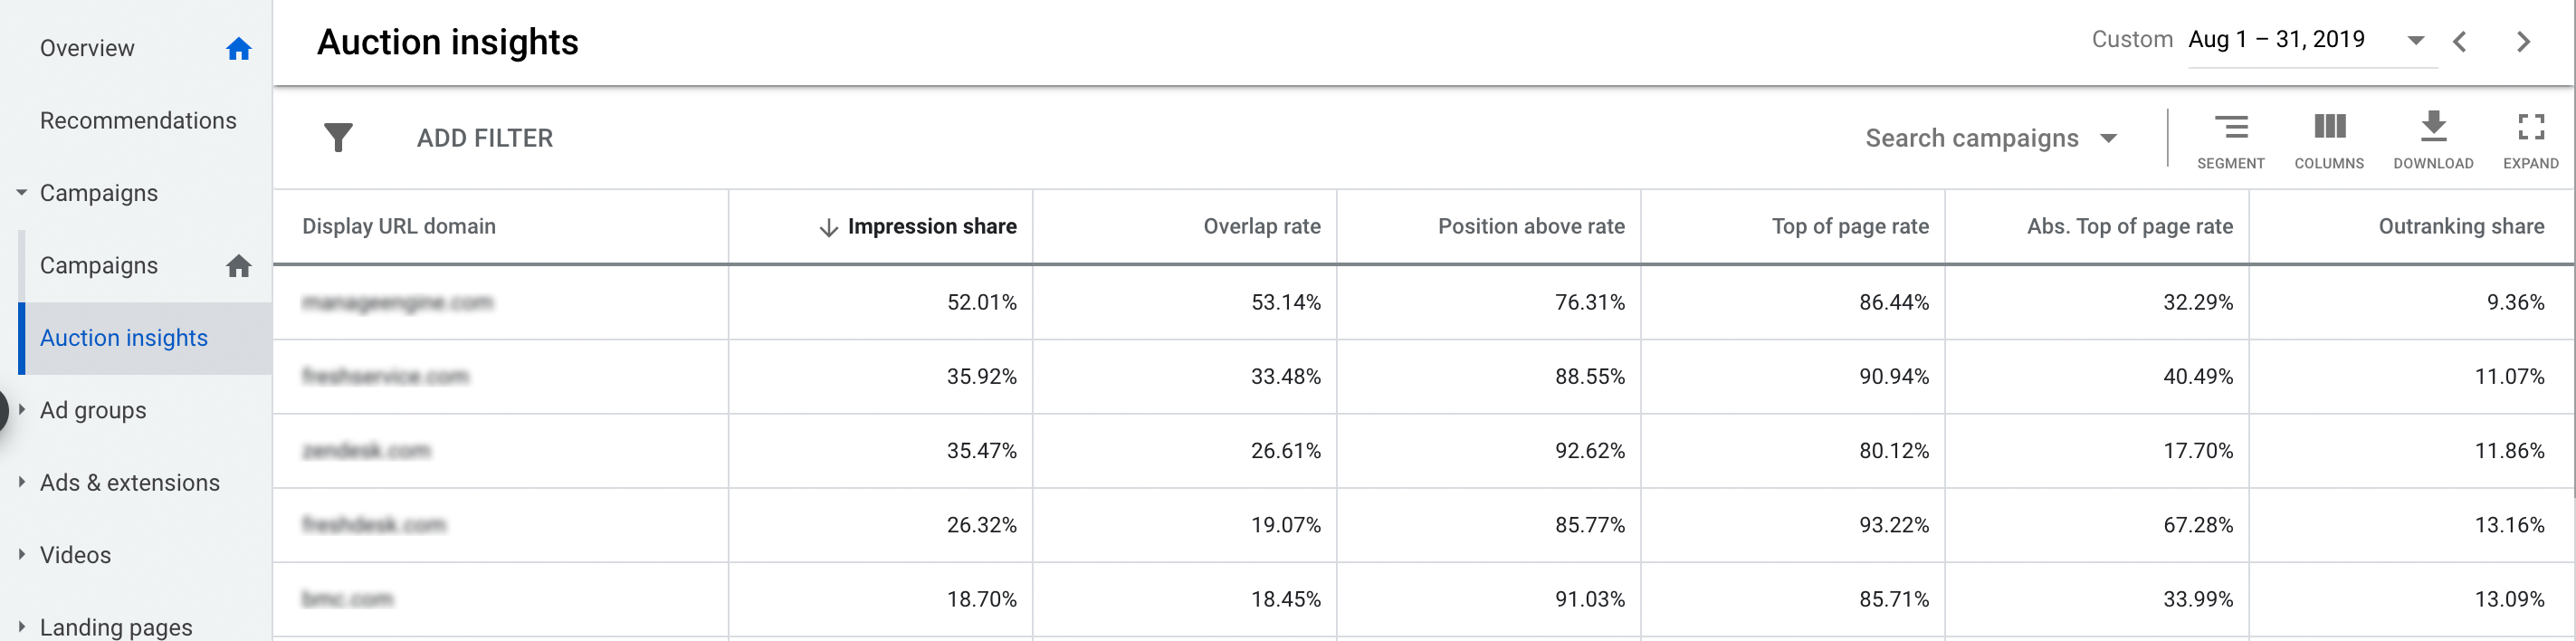
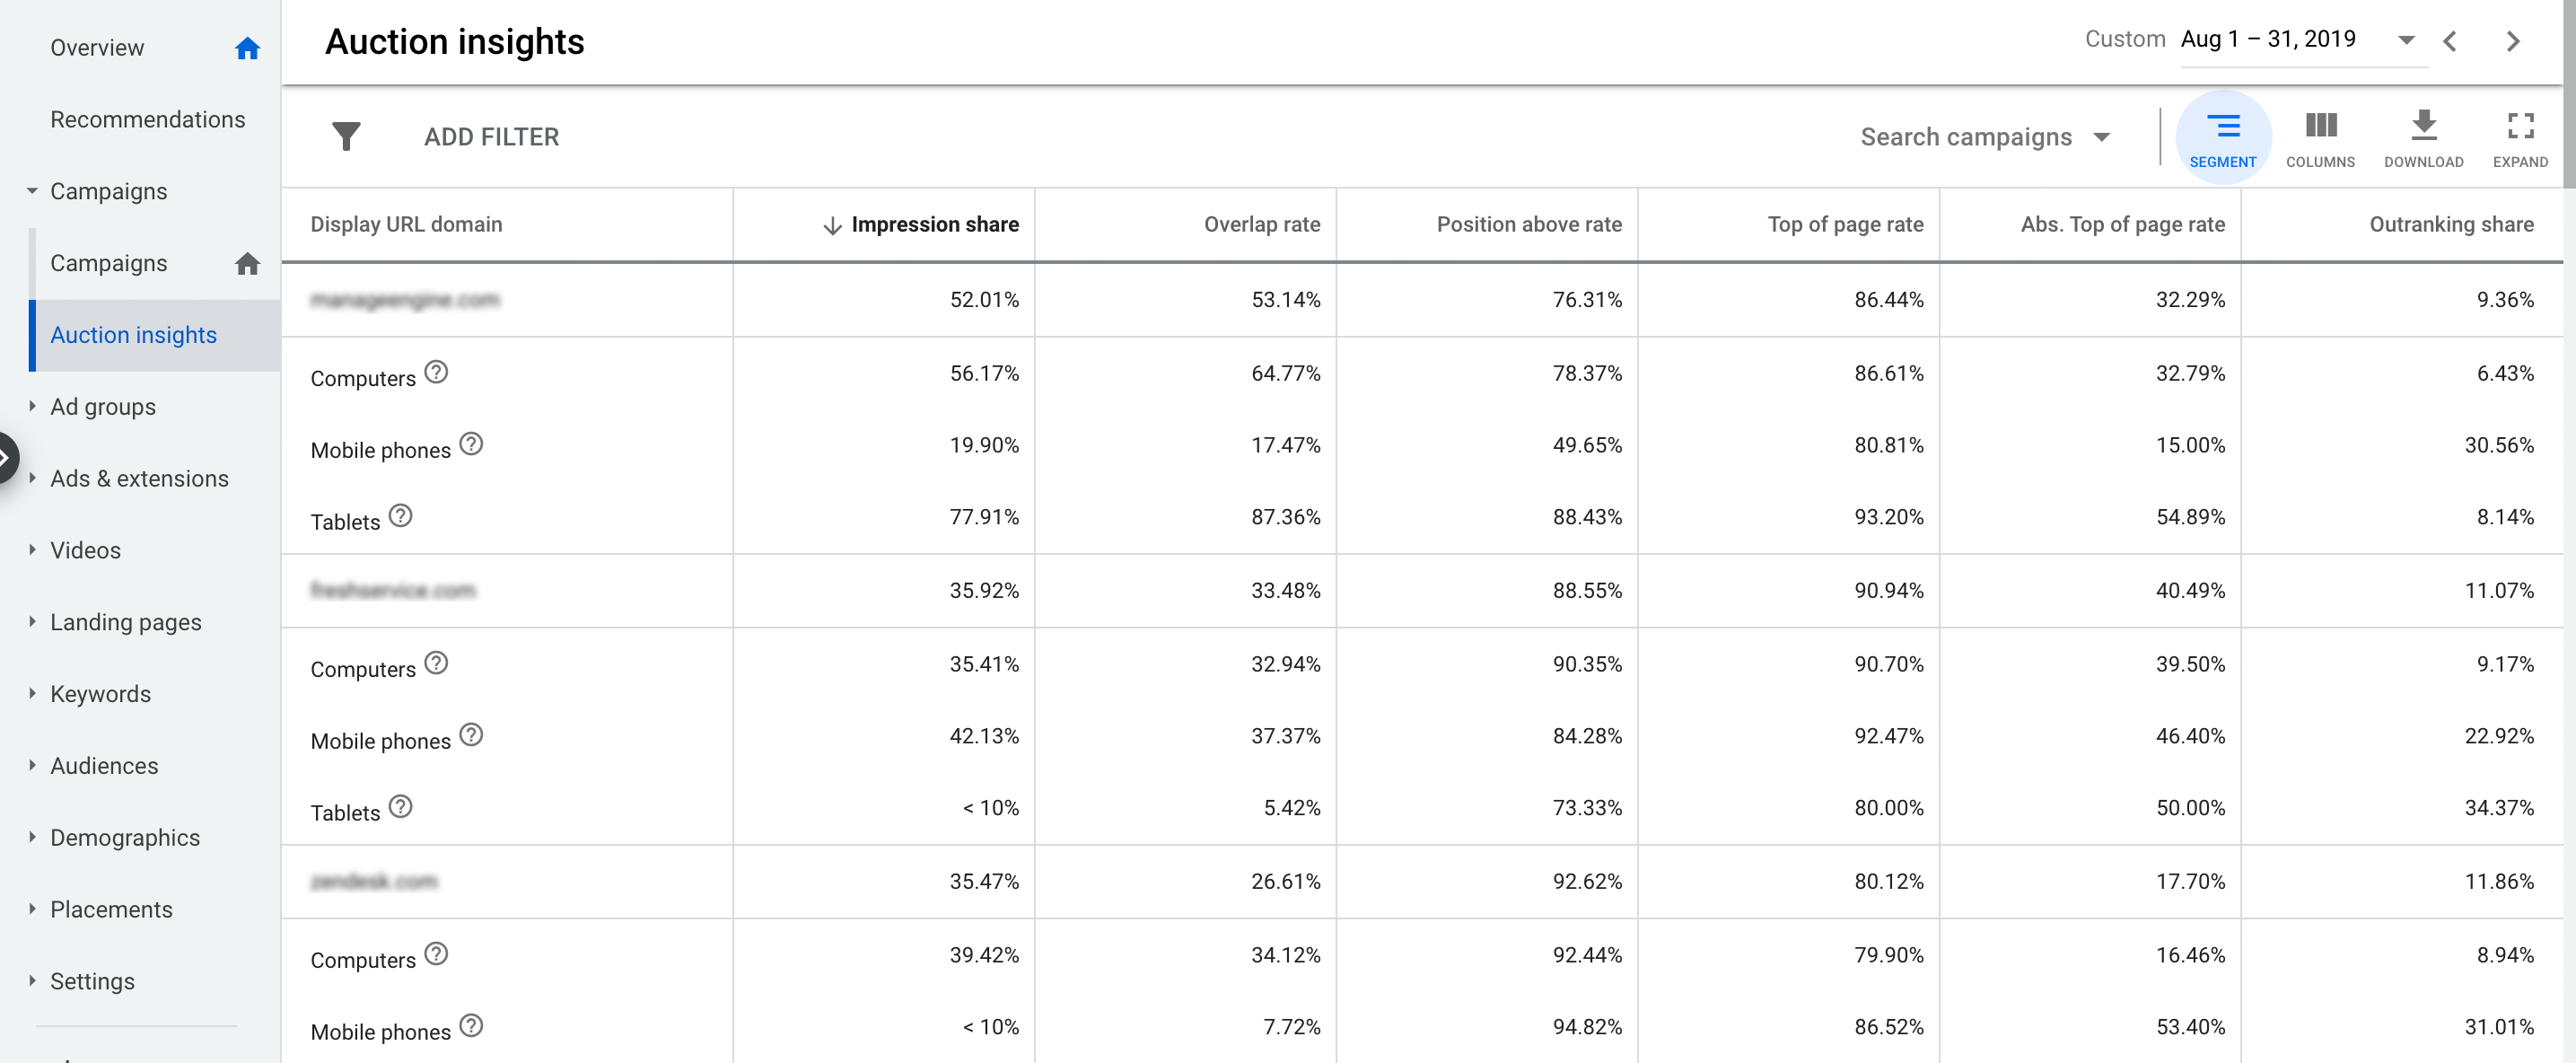
  2. Identify the keywords where the competition is doing better using Auction Insights provided in the Google Ads console. You can improve your impression share & absolute positions for those keywords
  3. Check your campaign performance regularly and ensure your position & ads are appearing without any budget or billing related issues

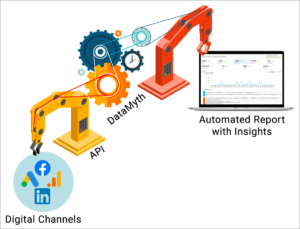
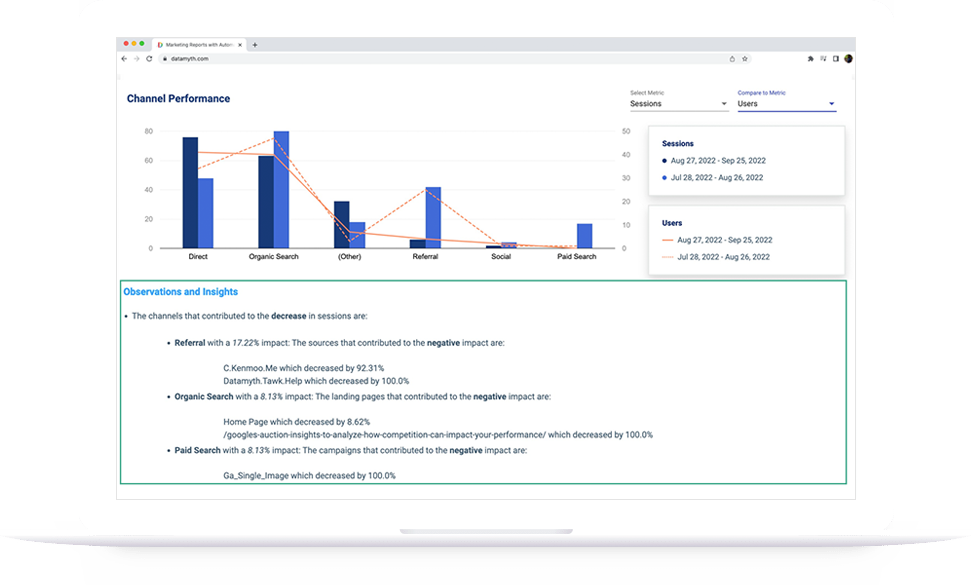
Search Term & Auction Insights reports are very important for campaign optimization. The above steps are the base to start your campaign analysis. Test it out, and let us know if it made a difference to your optimization. To quicken this process to identify the insights, get unlimited access to DataMyth with the Free Trial for 7 days. DataMyth provides insights and analysis with the click of a button.

Categories
Social Media

Social Media for Brands: 5 Tips to Get You Started

Social Media is known to be one of the best ways for brands to interact with its audience directly. While building a following is key and difficult at times, consistency and the right content at the right time is what will get you the required results. Here are 5 tips to get you started.

Tip 1: Start with a Social Media Calendar

The First step to interacting with your audience on social media is to create a plan or a schedule of posts. Here are a few benefits that will help gain more traction and a following with a well-organized social media calendar:

  • Planning in advance helps improve efficiency and reduce the time spent on a daily basis
  • The calendar adds a rhythm and order to the posts
  • Maintain frequency and ensure punctuality

Tip 2: Identify the Right Time

Social media calendars are generally created on a weekly or monthly basis. Larger companies with enough content, data and resources plan out monthly calendars, whereas the weekly calendar is most popular format among small and mid level companies looking to gain followers. 

Now that your calendar schedule has been decided, the next step would be to plan out the days and time to post. The best time, days and frequency vary according to various channels, industry, and the preferences of the company. There is no single proven formula for this. You can leverage a mix of research – based info and your company’s strengths, to arrive at a particular formula. Here are some of the best days of the week and the frequency according to Sprout Social and Coschedule.

  • Facebook
    • Tuesday, Wednesday and Friday 
    • 9 a.m.to 1 p.m.
    • 1 post per day
  • Instagram 
    • Tuesday 11 a.m. to 2 p.m.
    • Monday through Friday 11 a.m.
    • 1 – 2 posts per day
  • Twitter
    • Wednesday 9 a.m.to 3 p.m.
    • Tuesday through Thursday 9 to 11 a.m.
    • 15 tweets per day
  • Linkedin
    • Tuesday through Thursday 
    • 9 a.m. to 12noon
    • 1 post per day

Tip 3: Get the Right Post on the Right Channel

The type of content that works on each social channel differs based on its nature. For example, when on Instagram, your posts need images to tell your story. Here’s a quick look of what we’ve seen:

  • Facebook: Links to content in various formats – videos, short form content, etc.
  • Instagram: High resolution images with a story around it
  • Linkedin: Curated  links with information about your industry
  • Twitter: While tweets can go up to 280 characters, 33 characters is the average

Again, as mentioned there is no exact right formula for your company. 

Tip 4: Bring in the Right Mix of Content

Posts can be your own, curated from various credible sources, or content that promotes your product/service. To arrive at the right mix, you can take your own data into consideration, and map it with an existing formula. Here are the most common formulas followed by firms: 

  • Rule of the Third: 1/3rd of curated , 1/3rd own content and 1/3rd promotional
  • 4-1-1 Rule: 4 own content posts, 1 re-share for every 1 promotional content
  • 30-60-10 Golden Ratio: 30% own content , 10% promotional, and 60% curated content

Depending on the formula you choose, you may lean more towards generating your own content, or curating content.

Tip 5: Content Based on the Day  

The type of post on a particular day can be tweaked according to the popular mood of the audience, and the channel. For example posting on LinkedIn on the weekends is a bad idea because it is used predominantly on weekdays by most working professionals. Here are a few curated ideas to get you started:

  • Monday: Motivation to start a productive week, Monday blues, groggy after a weekend
  • Tuesday: Graphic with advice, facts, trivia or titbits related to your industry 
  • Wednesday: Motivation to power through the second half of the week, focus on personal wellness, growth and development
  • Thursday: Throwback to your company’s story and history to enable customers to connect with the company. This is the best day to post on social media and gain traction
  • Friday: Best day to share a fun, playful or a happy post from the company – happy customers, staff members,  or celebrate the happy onset of the weekend and connect with emotions

While you follow these tips to build your social media presence, it is also important to measure the performance. With DataMyth, you can have your Facebook ad campaigns analyzed within seconds at the click of a button in the near future. At the moment, DataMyth can analyze your Google Analytics and Google Ads accounts in minutes.

Categories
Reporting

A Guide to Google Analytics Reports

On an average, a digital marketer spends 7.5 hours in a week (based on a survey conducted by DataMyth) creating and analyzing reports across channels for clients/stakeholders. These reports generally are a combination of customized reports based on the client’s requirements or report templates which cover all the necessary information about your website performance in terms of traffic, goals, user behaviour, etc. Google Analytics provides a lot of data but not all of it gets in the weekly or monthly reports. In this blog we will cover the sections which we think are critical and mandatory for a client/stakeholder to understand the website performance.

This report structure will help answer the following:

  1. The number of users received for the selected date range
  2. The source of users by channel
  3. Top channels by user
  4. Campaigns/pages that drove the most sessions
  5. Top landing pages in terms of sessions
  6. Pages that people spend the most time on
  7. Time spent by users on the site
  8. Devices used by users to view the site
  9. Countries users visit from

1. An Overview Section:

The report should always start with an overview of the performance of your website for the selected date range. This section will give the reader information about the overall performance in the first few minutes. The synopsis should cover the ABC of Google Analytics reporting – Acquisition, Behaviour & Conversion. 

  1. Acquisition helps you understand the number of users and where the traffic is coming from. For example: Users, Sessions, Source, etc.
  2. Behaviour contains data which helps you understand  what users do on your  website such as Pages/Session, Avg. Time Spent & Bounce Rate
  3. Conversion data maps your Goals, Goal Rate & Goal Value

Along with the data table, adding graphs makes it more visually appealing and increases the ease of understanding. You can either show the trend for the selected period or for the last 6 months. 

Always ensure to add insights that not only identifies the increase or decrease, but also defines the reason for the change in performance

2. Source of Users by Channel :

While the overview section provides a summary of the performance, the Channel performance section maps your traffic by different sources such as Email, Organic, Paid, Social, etc. An easy representation of performance by channel helps understand which channel is doing better compared to the others.

Now that the data is displayed, one of the important elements to include is the analysis of how the performance was impacted by each channel for the selected period (single date range or comparison date range). Showing a percentage increase and decrease is not a clear indicator of your website’s performance since a change in a channel goal from 1 to 2 is a 100% increase. So ensure that your data is calculated taking the impact of each parameter into consideration, and not the percentage difference. Once the channel is identified, next, find the pages/campaigns that triggered the impact for the respective channel.

3. Goal Completion

Based on the goals set for each channel which is inline with your objective, Google analytics provides data for each of the goal types across channels. While this is very helpful you will not receive a consolidated view of all the goals created. So showcasing goals by type & channel gives a clear picture of your goal performance.

Considering the goals set, identify what’s working and what’s not by channel source. Just like we discussed in the channel performance section, calculate the impact here as well instead of the absolute difference. If you are an eCommerce brand, you will have a clear understanding of your ROI by channel. You can optimize your marketing efforts building on this information.

4. New vs Returning Users Performance

It is very important to understand your website user type (new or returning). If you are an eCommerce, media or entertainment client, you should have a good balance between new and returning users. If your brand is focused on B2B, it is better to have more new users than returning users. Providing a breakup of channel & device for traffic & goal will give additional information about your marketing efforts and their results.

For example, the image in this section shows that even though Email drives the highest number of sessions, it does not result in goal conversions for new users, whereas Organic Search goal conversions are higher than Email campaigns. Based on your industry & data, you can make changes to your marketing efforts accordingly. 

5. Identifying the Top Landing Pages

Google Analytics provides landing page reports with traffic, behaviour and conversion details but what matters most is to answer a few questions like:

a) why did the traffic increase/decrease?

b) why is the bounce rate for the page high?

c) which pages do users spend most time on?

To get answers to these questions, we should drill down further into the data. Check the source, device & user type for the page which generated the highest sessions, or low bounce rates , whichever your key metric is. Based on the data available, optimize the page to improve the performance.

6. Device Performance

Understanding the device your audience uses helps you optimize your campaign targets, website speed and responsiveness. Along with the overall device data, knowing the channel source for each device can help define the marketing efforts for the respective channel.

7. Location Performance

Location is a very simple yet important element for your analysis. It shows where you are getting your majority of traffic or goal conversions. Based on this data you can target locations for campaigns or allocate more budget.

Apart from these there are other reports like

  1. Hourly report to understand at what time of the day you are driving sessions or goal conversions 
  2. Page Navigation Report to understand how the user navigates through your website. Are they getting all the information needed or they abandon the page due to lack of information, bad user experience, it is not optimized for a device & etc. 

All the sections covered are present in the Google Analytics console, and each section is a different report that needs to be combined. DataMyth is a solution that can build the report within seconds with data, graphs and analysis – All you need to do is use the time saved to define your strategy. Visit the Google Analytics Report page for more details.

Categories
Automation Reporting

3 Reasons to Automate Your Digital Marketing Reports

As a digital marketer one has to create daily, weekly and monthly reports. Even though it may feel monotonous it is a critical part of your business. As per a survey conducted by DataMyth, we found that companies spend an average of 7.5 hours a week building various digital marketing reports with analysis which is almost an entire day every week. So you have a resource who spends time building reports  wherein he/she could spend this time optimizing campaigns or taking up additional responsibilities.  While you may figure out ways to automate your reports, you still need to analyze the data and present it to your client/stakeholders. What if you figure out a way to automate this entire process (report generation to analysis)? This blog will introduce you to automating reports, its advantages, and ways you can do so.

Reporting Automation in Simple Terms 

Connect all your digital channels to a software/platform that builds your daily, weekly and monthly marketing reports within seconds/minutes.  All digital channels provide APIs that fetch your data and the automated reporting software/platform builds your report. 

Why should you automate your reports?

  1. Hours of reporting reduced to seconds
    1. We’ve discussed how the time taken to build your reports can be reduced to seconds. You can end the blind data ‘copy-paste’, downloading various csv files and analyzing the data to identify insights. With automated reporting, ready to use reports will be available at the click of a button within seconds. 
  2. Focus on new initiatives
    1. Now that the reporting is automated with performance insights, you know exactly what is working and what is not. You can spend your precious time on optimizing & taking on additional initiatives for your business. 
  3. Increase your team’s effectiveness
    1. For agencies, you can increase the number of clients handled per analyst, and brands, you can focus on additional initiatives with small & agile teams

Which tool is best for me?

There are a lot of tools available in the market right from BI (Business Intelligence) dashboards to reporting solutions. 

  • While BI tools provide full funnel reports, they are complicated to set up and need to be maintained by SMEs/experts.
  • Dashboard tools (like Google Data Studio) are not as complicated as BI tools, but not easy to use. You can connect your channels & create dashboards but you might need to pay in order to connect the channels 
  • Many reporting tools available in the market let you drag and drop KPIs & graphs creating a simple dashboard ready to be shared with your client. This is easy to use, needs a one time setup & the user friendliness depends on the tool.

All the above mentioned tools provide the data you need in various templates (some are fixed & some offer custom templates), but once you receive the data in the desired format, you spend significant time analyzing the data which most of the tools do not provide.

Here’s where DataMyth can help. Created by marketer who wanted to skip downloading, processing and analyzing data. It’s an easy to use tool with pre-built templates for each channel (Google Ads & Google Analytics to start with) with automated analysis and performance insights for the KPIs which matter the most to marketers. Reports built with DataMyth can be downloaded as a PDF & shared with stakeholders/clients.

While this may sound too good to be true, have a look at how we simplify your process below, and take the 7 day free trial to see for yourself.

Categories
Reporting

5 Tips to Building Your Digital Marketing Reports

‘Plan – Launch – Optimize’. While you follow this principle to gain the best out of your marketing campaigns, here are 5 tips to get you going with building digital reports.

TIP 1: Define your KPIs

To define your KPI, start by revisiting your objective that has been agreed upon by the key stakeholders. Next, map the objectives against various metrics. Have a look at the table below that lists out a set of sample KPIs based on different objectives.

Objective Possible KPIs
Awareness/ Visibility
  • Impressions
  • Reach
  • Views
  • Clicks
Lead Generation
  • Number of form-fills
  • Number of asset downloads
  • Cost per lead
Sales
  • Number of sales
  • Average revenue
  • Cost per sale
  • ROAS (Return on Ad Spend)
Engagement
  • Number of interactions (Likes, comments, shares, etc.)
  • Time spent on the website
  • Pages per session

Tip 2: Reason to build the report

Are you building your report to showcase the results to your Stakeholders, or is the report going to help you optimize the account? The format of the reports will change based on your answer to this question. Stakeholders want to see an overall performance, a summary of how the campaign is doing. While a report meant for inputs to optimize campaigns will dig deeper and identify each and every metric that has seen a change in the positive or negative direction.

Here are examples of the format you could follow for each of the requirement:

Stakeholder report: An overview of what is happening in the account, what is working and what is not, where you stand against your goals & what’s the next steps planned

Analyst report: A detailed breakdown of performance based on metrics (KPIs) for each elements such as campaigns, ads, landing pages, etc which can be used as a base to optimize your campaigns

Tip 3: Select a Format that is Repeatable

While zeroing down on a report format, remember that this has to be done on a regular basis. So ensure that you capture the right KPIs and that the format should be easy to continuously replicate. 

Tip 4: Analyzing the data

This is the most important step in building reports. While analyzing the data, start with the top down approach. Identify the performance at an account level, do you see an increase or a dip in performance? If you find an improvement in performance, start digging in deeper till you reach the lowest level of tactics like keywords, placements, text ads, banner ads, etc, and identify the different causes of the impact by analyzing the metrics that are your KPIs. Once done, don’t forget to repeat the same exercise for tactics to identify the ones that saw a dip in performance. This will help you catch instances that will continue to negatively impact your campaign.

Tip 5: Automate Your Report

Since you are going to build the same reports over and over (in terms of format), start optimizing and automating your reports to save time and reduce human error. There are various ways of getting this done – 

  1. You can use APIs to fetch data faster in a format that is easier to analyse, and build Macros to initiate your analysis
  2. You can also manually fetch the data and use Macros to build the required format and initiate your analysis
  3. The 3rd option is to identify a 3rd party tool that generates your stakeholder/analysis ready reports

Implementing these 5 tips will help you define your report, analyze your data, and finally save on time. This can have a direct impact on the campaigns you run as you can start optimizing based on the insights and the time saved can be used to define your next steps.

DataMyth is a report automation tool that provides insights and reduces the time taken to build reports from an average of 7 hours a week to a few minutes. Interested in checking out DataMyth? Fill out the form.

Categories
Research

5 Tips to Build keywords for your Google Ads Campaign

Identifying the right set of keywords is the starting point to defining your campaign once you have your strategy identified based on the campaign objective. When identifying the keywords, the goal here is to ensure that you identify the keywords that your audience would search for when looking for a solution you provide. This blog contains 5 tips which helps you to define or find the right set of keywords to include in your campaign.

1. Put yourself in the shoes of your target audience

You know your product/service well. Write down the terms which are highly relevant to your business along with the terms your  potential audience would use to describe or search in a Search Engine. This list will become your base to start searching with using keyword Planner tools like ‘Google Keyword Planner’ or ‘ahref’. 

For example, if you sell women’s watches, your base list may contain terms that customers would use – “women’s watch”. Along with it you can also add terms such as “women’s sports watch”, women’s formal watch”, “watches for women” and “ladies watches”. This list can also include your brand name. 

2. Add generic keywords to maximize reach 

To expand your reach, you can test generic keywords associated with your product/service. A word of caution here – these are highly competitive keywords with low relevance. You would need to keep a close watch and ensure that you are constantly adding negative keywords to weed out irrelevant traffic and avoid unnecessary spends.

These  keywords may not drive high quality clicks, However, you can test these keywords and based on performance decide which ones to keep. An additional benefit of using generic keywords is – you can identify core keywords from the list of search terms that you may have missed in your initial set of keywords.

For example, if you have “watches” as your keyword, this might trigger you ads to appear for search terms such as “repair watches”, “kids watches”, “watch shop” etc. You can add negative keywords like “-kids”, “-repair”.

3. Control your ad visibility with the use of  match types

The match type determines how closely your keywords match the search terms. Keyword match types explained by Google:

Image source: Google Ads Help

Do note, it isn’t necessary to have all the match types added to your campaign. You can use these match types to control the visibility of your ads, and control the relevance. Broad match can serve your ad on a wider variety of user searches and exact matches can help you get specific to the user searches. Also, exact matches would work perfectly as you can control what keywords you want to be present for and showcase your ads, you will miss out on other important keywords where your competitors can cash in. Finding the right balance between these match types will be key to defining the performance of your campaigns

4. Build keyword clusters based on a common theme/intent

Clustering your keywords on a common theme helps you show the right ad for the right keyword as you can write highly relevant ads for each cluster.These clusters will now become your ad groups.  Following this rule to define your ad groups also gives you control to ensure that the ads are relevant, which you can keep improving over the course of time. What you would definitely want to avoid is putting all your keywords in one adgroup. For example a user looking for “women’s luxury watch” may see an ad that is generic to women’s watch.

5. Negative keywords are a huge positive

As mentioned earlier, negative keywords are used to exclude your ads from appearing on searches with that term in it. Choose your negative keywords very carefully. Adding too many negative keywords might result in a lower reach. The best way to expand a negative keyword list is to check the “Search Term” report to identify the terms that may include your keyword, but are not related to your business. 

For example, if you are selling “sports watches” (broad or phrase match), your ad might have appeared for the search term “watch repair” or “sports watch not working ”. In this case you might want to add terms such as “repair” & “not working” as negative keywords. Once you identify the negative keywords, consider adding synonyms, singular or plural versions, common misspellings, and other close variations.

These are some basic tips to get you started. Ensure that you constantly check the performance, and optimize your keywords to drive the best performance.

Categories
Reporting

Digital Marketing Report Frequency & Their Outcomes

Report building is very critical for any agency or brand. With the right KPIs measured in the reports, a campaign manager/stakeholder can understand how his marketing campaigns are performing & can   make data backed decisions. Most agencies or companies share reports with their clients/stakeholders on a regular basis. It can be weekly, monthly and/or quarterly. This blog covers the different report frequencies and what are the outcomes you can expect. 

Daily Reports:

Daily reports are used mainly for internal purposes which include the KPIs, critical and important to your client/stakeholders. It helps you identify any anomalies or changes and you can act immediately. 

Example: If the Campaign ‘actual daily spend’ is more than the target spend, you can spot it immediately and modify it accordingly. 

Daily Report Outcome:

  • With Daily reports in place, you can find a trend in your campaign/website performance 
  • You can spot anomalies in KPIs which need immediate attention 
  • A constant status check on the performance against goals 
  • Ensure that both the campaign manager & the client/stakeholders are on the same page

Weekly Reports:

With weekly reports you can measure performances against your short term plans and  track variances compared to the previous period performance. Along with it you will be able to identify metrics/elements that  are working and the ones that  are not, based on the tasks carried out with respect to their results. You can share the weekly reports during the first two days of the week (Monday & Tuesday) and plan for the week. The day can be finalised based on your convenience and your clients. Some reports are scheduled based on the stakeholder’s meeting with higher-ups, which would need the most recent data. In general these meetings happen in the first 3 days of the week (Monday – Wednesday), So you would end up creating the weekly report on the previous day of the meeting.

Example: Introducing a new set of keywords during a week could either boost your conversions or result in a high cost. You need a couple of days to gather significant data and see if the newly added keywords impact your performance in positive or negative. However, this could be an initial check to see if the keywords are spending without any outcome.

Weekly Report Outcome:

  • You can check  if the performance increased or decreased, with reasons that identify the  campaign, keyword, channel or landing page responsible for the impact
  • You will be able to clearly identify what is working and what is not, based on the tasks carried out, and compared to short term goals
  • You can plan your actions according to the recent performance

Monthly Reports:

Monthly reports are the best way you can highlight your campaign KPIs which are critical to your client/stakeholder. You can showcase results of the long term plans/actions taken over a period of time, determine where you stand against the goals, and define if the campaign is on track or not. The monthly reports help the Directors/CMOs to plan their marketing efforts going forward.

Monthly Report Outcome:

  • Like weekly reports, even these reports help you understand what is working and what is not, for a longer time frame as weekly data is generally not sufficient to take decisions
  • Which channel or campaign impacted your performance 
  • Your plans/recommendations to derive better results and either recalibrate goals or recalibrate plans to meet the goal

Here’s a quick summary of the 3 reports:

You can use daily reports internally while the weekly & monthly reports are made for clients/stakeholders as well as  to optimize the campaign. Ensure the Weekly & Monthly reports cover the main elements  in the summary slides such as

  1. Ensure that all the important KPIs are covered
  2. What happened & why it happened
  3. Was the performance in line with your previous plan or not? 
  4. What is your plan/recommendation to either improve performance or maintain it?
Categories
Analysis

Google’s ‘Auction Insights’ to Analyze How Competition Can Impact Your Performance

Google Ads is one of the most promising paid channels that delivers ROI. So while you run campaigns, utilizing all or at least most of Google ad’s features will help you gain insights to strengthen your campaign performance. One of these features that is probably not used by a lot of marketers is the ‘Auction Insights’ report. 

While running campaigns on Google Ads, you will come across situations where the  performance changes are not always directly related to the changes made by you as a part of your optimization plan.  The performance could be a result of external factors like seasonal trends, competition, etc.   This is where ‘auction insights’ comes in – You can identify market opportunities by analyzing your competitors who are participating in the auction and make changes to your bids and budgets.

Let’s see how an ‘Auction Insights’ report can help you make strategic decisions & improve campaign performance. The rest of this blog will help you understand and make the most of this report with 4 simple steps.

What is an auction and what will an Auction Insights report contain?

Whenever a user searches on Google, in the background Google runs an auction to choose which advertiser’s ad should be served, and at what position in the sponsored section of the SERP within sub-seconds. Google now provides 5 metrics to help analyze the competitors that rank for a keyword in an auction insight report, specific to Google Search campaigns, and 2 metrics (Impression Share & Overlap Rate) for Google Shopping campaigns.  

Understanding the metrics:

  1. Impression Share – The number of impressions received divided by the estimated number of impressions you were eligible to receive. A high percentage here translates to a healthy brand takeover, and a low percentage translates to a high volume of opportunities missed.
  2. Overlap Rate – The number of times your competitor received an impression when your ad was displayed. When the report shows 40% against a competitor, it means that your competitor’s ad was shown 4 times off the 10 times your ad was displayed. 
  3. Position Above Rate – The number of times a competitor’s ad was shown in a higher position than yours, when both of your ads were shown at the same time.
  4. Top of Page Rate – The number of times your ad (or the ad of another participant, depending on which row you’re viewing) was shown at the top of the page, above the unpaid search results.
  5. Outranking Share – The number of times your ad ranked higher in the auction than the competitor’s ad.

Where do you see the Auction Insights Report on Google Ads?

The Auction Insights are available for one or more Keywords, Ad Groups & Campaigns. The Auction Insights report can be selected on the left menu in the Google Ads console. 

What are the questions Auction Insights can help you answer?

  • Who are the competitors competing at the auction? 
    • The report calls out the list of competitors that are a part of the same auction as you, as well as lets you see how active your competitors are.
  • Any new competitors bidding for the same keywords?
    • Comparing different date ranges, you would be able to see if any new competitors are bidding for your keywords. 
  • Any competitors changed their bidding strategy?
    • By looking at the change in Impression Share & Position Above Rate, you will be able to track changes in your competitors bidding & budget strategies. An increase in budget would increase the Impression Share & an increase in bids would increase their ad position on SERP which might improve their Position Above Rate compared to yours. 
  • Which device is the competition concentrating on?
    • With the Device segmentation, you can track the devices your competitors are focusing on. For a keyword or a set of keywords, you would know exactly how the device target has been set & you can optimize your device strategy accordingly.

  • At what time or day the competitors are aggressively bidding?
    • Like device segment, Time segment helps identify when your competitors are aggressive compared to you. Based on this you can optimize your bidding strategy based on when they are active & low. 

Pointers to improve your performance based on Auction Insights:

  1. Increase your campaign daily budget to improve your Impression Share. If you don’t have the room to improve the budget, analyze competitor ads by either searching on Google or use tools like SEMRush. Now based on the information available, identify ways to improve and refine your ad copies.
  2. By increasing your CPCs, you can increase your Top of Page Rate Improving Quality Score would help achieve a lower CPC with a higher Top of Page Rate.

Do monitor this report and you can derive insights and strengthen your strategy and performance.

Categories
Analysis

Data Driven Analysis – 5 Tips to Improve Your Analysis

As a digital marketer, you run campaigns across multiple channels & mediums. You deal with a lot of data on a daily basis and analyze it to identify a pattern or trend based on your optimization tasks which you carried out earlier. Data and analysis go hand in hand to ensure that these campaigns are efficient and effective. According to Gartner, 81% of marketers expect the majority of their decisions to be data-driven by 2020. 76% say that’s already the case. Data is the key to knowing what is working and what is not, so that you can drive faster decision making and deliver the right content/message to your audience at the right time. The tips mentioned in this blog will help you streamline your analysis faster. So here goes!

Tip 1: Analyze the Right Data:

Every channel or medium provides a whole bunch of data, but not everything aligns with your marketing strategy or goal. Pick the right metric that would help achieve your goal and align your marketing metrics from each channel to these metrics. For example, if your goal is to drive visibility you need to drive impressions/views. The next step would be to map the metrics to each channel like – Impressions for Google Search and Views for Facebook & LinkedIn. 

Tip 2: Prioritize Your Data Source:

If you are trying to drive leads and your campaigns are live across multiple channels, start with the channel that is driving a higher volume of leads where-in a minimal effort can drive a higher return. To get to this stage, analyze data from the different sources and prioritize the channels based on metrics like lead volume, CPLs, etc.

Tip 3: Identify What’s Working and What’s Not: 

Now that you have your data by channel and you know what is driving results, dive deeper to understand what drives these results. For example, if Paid Campaigns are driving leads, find out which keyword along with the match type that is working, the position at which you receive the maximum results, the ads driving results etc. Try to find as much as detail you can from campaigns or data available. 

Tip 4: Answer the Why: :

This is a critical step that is generally skipped, but adds a lot of value to your analysis. Now you have identified what is working, along with what is not working, dive deeper to understand the reason. What was that one thing that caused the change in performance. This will help you understand the change required and plan your next step. 

Tip 5: Test New Strategies Based on the Analysis:

If you stop testing or implementing new strategies, your competition can easily overtake you. With deep data analysis, you can test new strategies based on your answer to the ‘WHY’ in Tip 4. Constant optimization will help drive better results over a period of time.

Remember that if your analysis is data-backed, the strategy you recommend will have a positive effect, some, more effective than the others. In the long run, you will gather more and more data and insights about your account making the strategies even stronger.